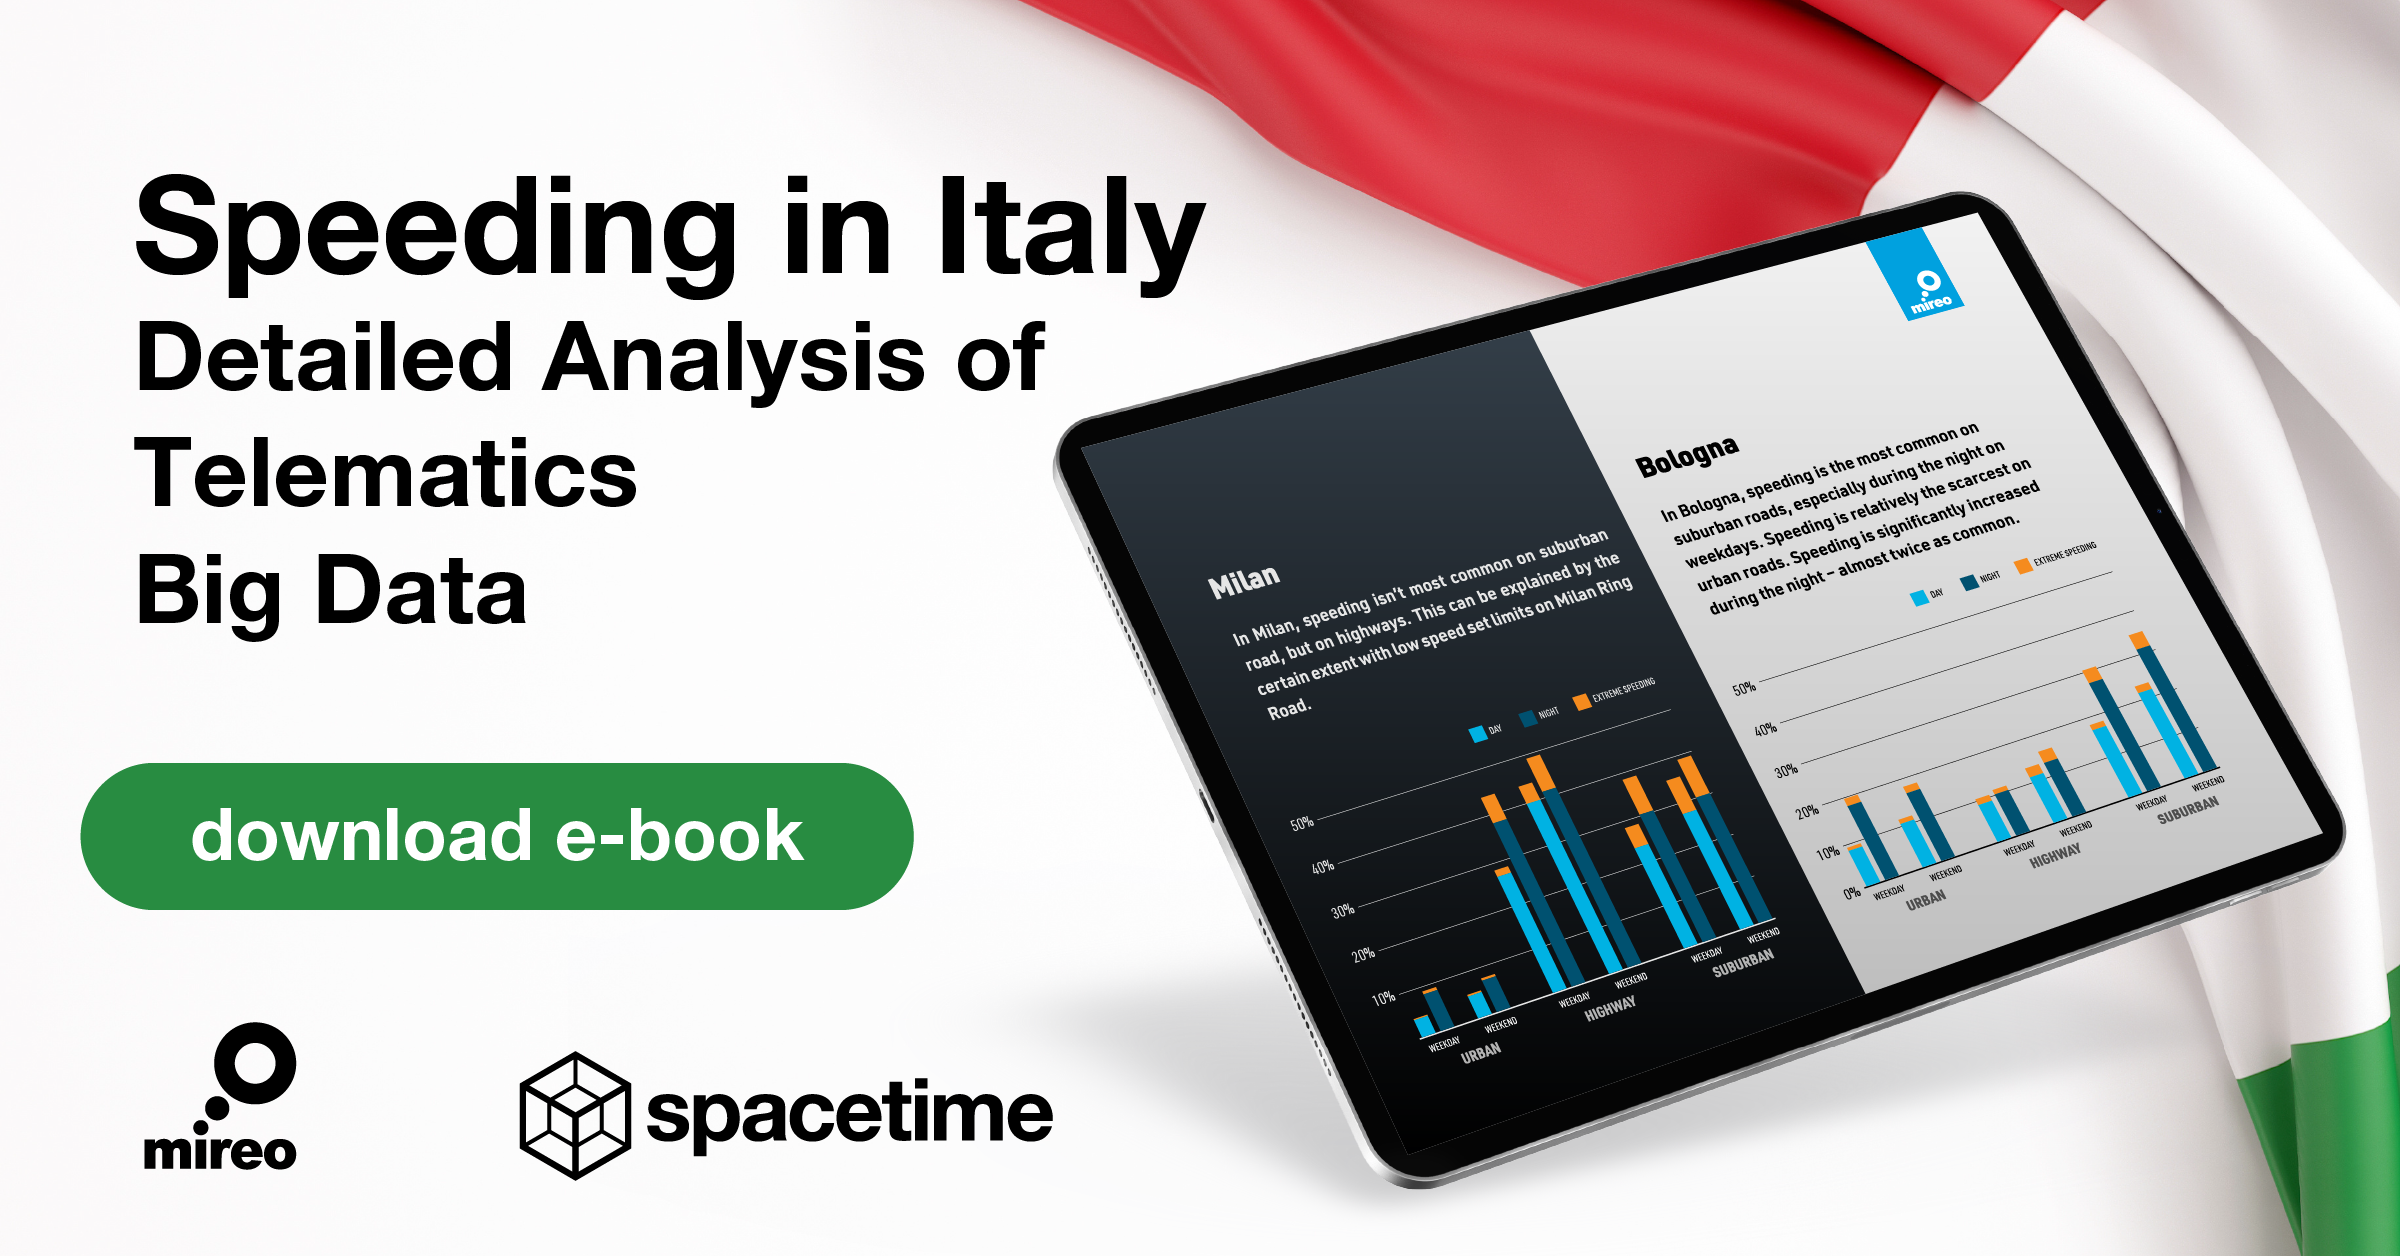
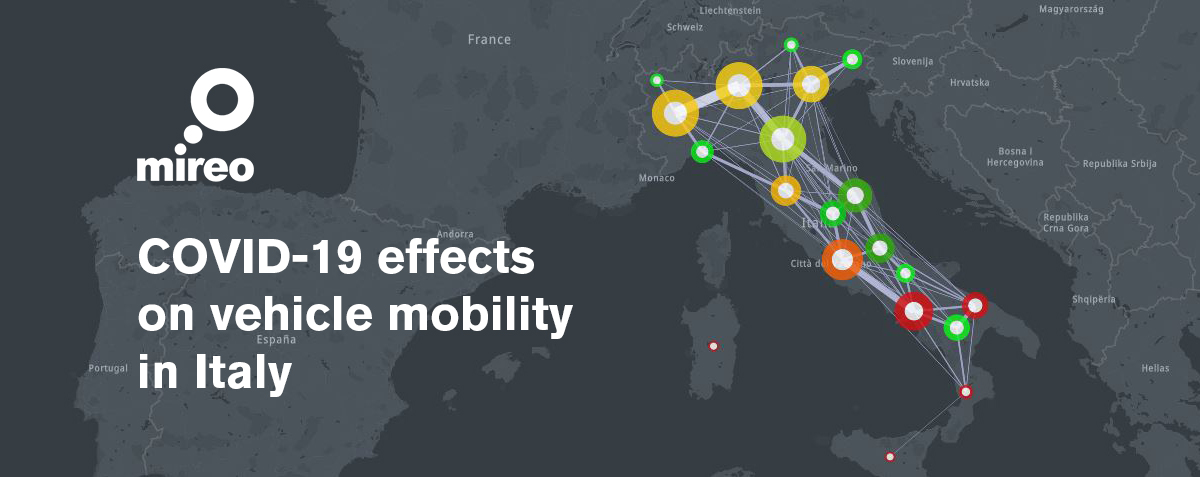
This blogpost covers typical travel patterns of vehicles throughout 20 Italian regions. It focuses on the change in travelling from one region to another, and how imposed quarantine measures affected them. The comprehensive analysis of the effect of COVID-19 on mobility, including the drop of circulating vehicles, average daily drives, changes in driving on highways, urban and suburban roads, and speeding patterns, is available in the e-book format, downloadable here.
At the end, we’ll provide eye-opening visuals, depicting the real impact of lockdown on the behaviour of general public in Italy.
Data source
At the beginning of May 2020, VEM Solutions, a Viasat Group company, provided us with a ‘small’ snapshot of GPS traces from 600.000+ vehicles, driven across Italy between February and May 2019 and 2020, respectively. Raw GPS positions were initially map-matched, their trajectories reconstructed and thus imported in the proprietary moving-objects database - SpaceTime, resulting in 50+ billion records and a 2.5TB dataset.
Our sample consists of roughly 95% of privately owned cars and 5% of commercial vehicles. The vehicles are homogeneously spread across Italy, forming a statistically representative set. The goal was to use SpaceTime technology as a tool to analyse the change in vehicles' travel patterns before and during the lockdown, as well as in Phase 2 (relaxing strict measures), focusing on non-standard geographic analyses.
Origin-Destination or Mobility pattern analysis
Origin-destination matrices quantify the number of trips between geographic areas, essentially describing travel patterns among certain areas. Only with the worldwide use of GPS data collected from various types of Floating Car Data, can the Origin-Destination analysis be put to another level. Prior to this, plain roadside interviews were a crucial part of the mobility pattern studies. Survey cards are handed down to drivers with questions like ‘What is your trip origin?’ and ‘Where did your trip end?’. Roadside surveys are highly dependent on the sample selection, and despite many mathematical gravity models developed to infill unobserved models, they lack precision and accuracy. Floating Car Data analysis, not only provides exact results, but surpasses the quality of plain roadside survey results. However, big data analysis of moving objects derived from Floating Car Data arises many challenges. Moving objects tend to create extremely skewed data, both time-wise and geographically making such databases hard to index properly (mobility is lower during the nighttime and more concentrated in the urban areas).
Mobility patterns in urban planning
Understanding the patterns of everyday movement and how different cities are interconnected, is one of the major steps in urban and long-range traffic planning, smart city programs, and in tourism. The most common use of the city traffic patterns, that naturally vary depending on the time of day and year, is efficient traffic lights management.
Geomarketing
Besides general well-being purposes, Origin-Destination analysis is a powerful tool in geomarketing, namely for strategic positioning and content targeting of billboards alongside roads. The add-on value is achieved when combined with appropriate online marketing e.g. to increase in-store visits.
GPS data is most often collected from users of various smartphone applications for navigation and traffic reporting. Besides Waze, multimillion-user traffic reporting applications are the Dutch Flitsmeister and the German Blitzer. The second source are data collected from GPS tracking devices in vehicles under Usage-Based Insurance programs. Such companies tend to use this valuable data as another stream of income, providing insightful and profitable data to marketing companies (plain GPS traces used for generating live traffic information are not that well priced). Data collected from Usage-Based Insurance programs tend to have a bigger value since it provides accurate demographic data.
Epidemic
One thing the world has learned from the recent COVID-19 pandemic is that each breach in the number of the infected had already happened 5 to 10 days prior. A mindful analysis of the movement patterns can be extremely useful in precise and targeted induction of precautionary quarantine measures.
Mobility patterns in Italy
Note: The analysis of travel restrictions between Croatian municipalities is available here. This Origin-Destination analysis aims to question the validity of travel restrictions imposed in Zagreb County municipality (with a focus on commercial vehicles) despite strong historical and economical connections.
Typical mobility patterns
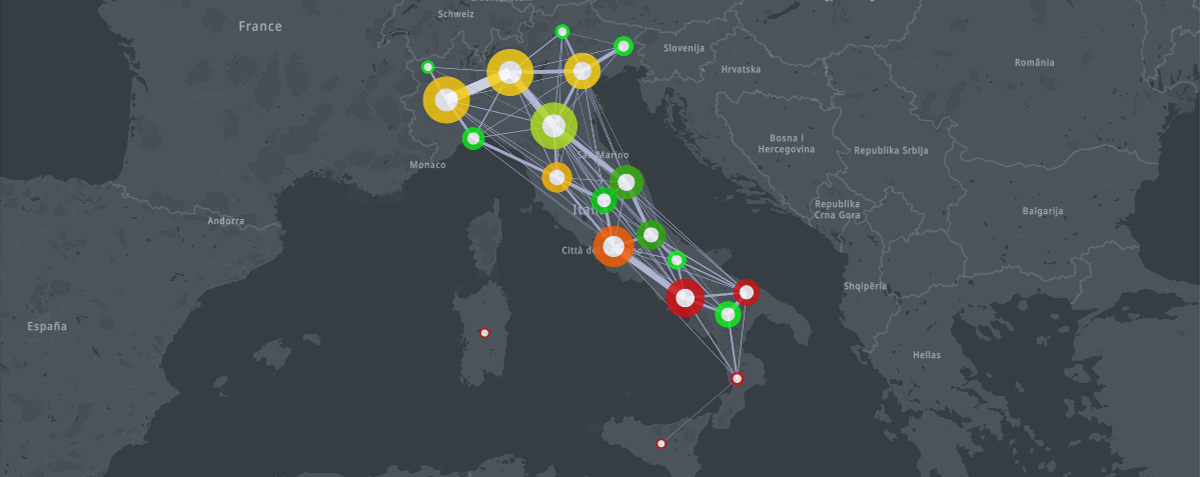
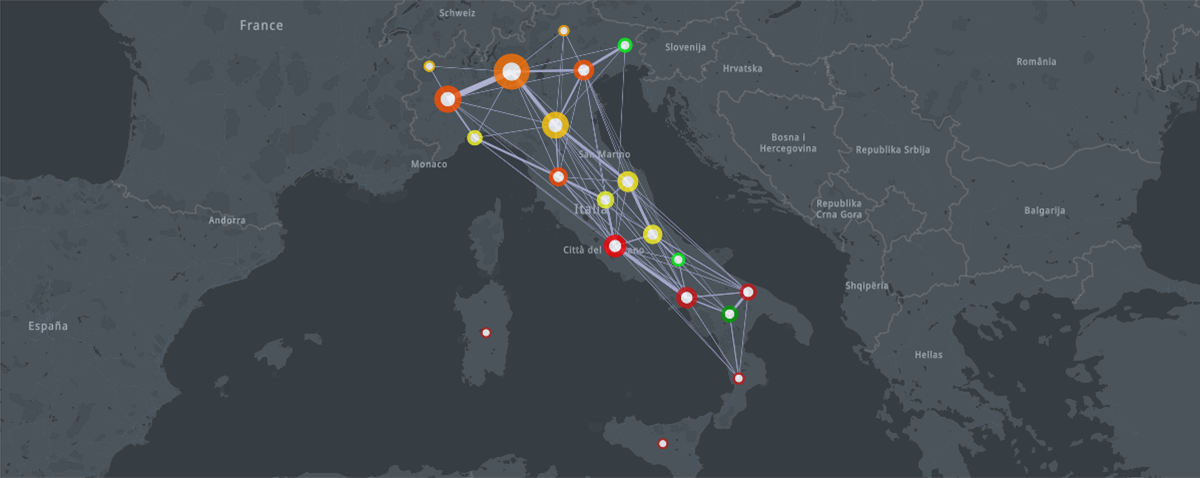
Legend: The circles represent Italian regions. The radius of a circle is proportional to the number of trips from other regions to the region represented by the circle (incoming trips). The thickness of the circle border is proportional to the number of outgoing trips. The colour of the circle border represents the ratio of domestic and combined outgoing and incoming trips, ranging from green to red. The lines between circles represent trips between two regions. The line thickness is proportional to the number of inter-regional trips.
Typically, there is frequent traffic between north regions, especially Piemonte with Lombardy, and Lombardy with Emilia Romagna. This does not come as a surprise since the northern regions are highly industrialised and subject to a may citizens’ movement for work reasons. Although close to northern regions, Ligurian Alps represent a strong physical obstacle for everyday mobility towards Liguria. When it comes to the South, the greatest amount of commuting happens between Lazio and Campania.
Commonly speaking, when it comes to general public, southern regions are more “closed". The number of domestic trips usually outnumbers incoming and outgoing (combined) trips by 20 to 70 times. In southern regions, domestic trips outnumber all others more than 200 times! Presumably, Sicily and Sardinia being island regions, are the most closed ones, where almost the entire traffic is an internal one.
On the opposite side of the spectrum is the Molise region, in which domestic trips outnumber others by only 15 times. Such strong mobility towards neighbouring regions, presumably due to work-related reasons, is the strong indicator of economic reliance. Moreover, strict travel restriction rules affected such regions the most.
The lockdown
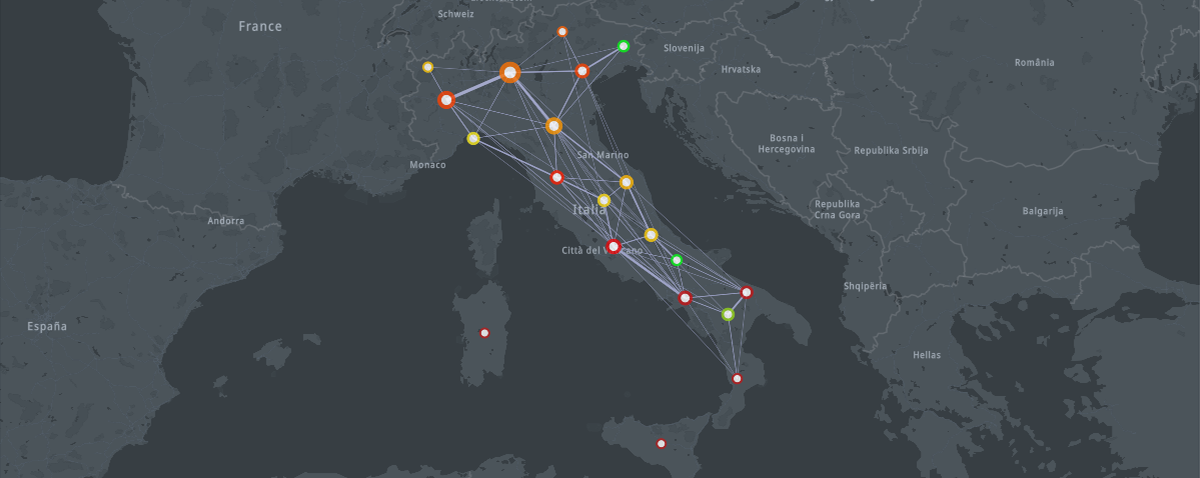
Mobility patterns during the lockdown
After the proclamation of lockdown, the interregional travel plummeted by 80% across all regions. To put it into numbers, 4 out of 5 people haven’t driven to other regions. Inter-regional trips decreased by 60%. The lockdown effect on the behaviour of commercial vehicles is less disastrous, but still apparent. Almost uniformly, all kinds of trips dropped on average, between 30% and 60%. The only exceptions are, again, Sicily and Sardinia with a doubled number of domestic trips! Although in lockdown, commercial vehicles there helped to guarantee essential goods and services and products to citizens.
Almost 70% of all COVID-19 cases occurred in four northern regions - Lombardy (38%), Piedmont (12%), Emilia-Romagna (11%), and in Veneto (8%). Approximately 3% of all cases took place in, each of the following - Tuscany, Liguria and Lazio. Lombardic province of Bergamo and Veneto region were the first two clusters of epidemic. These regions happen to be the ones with the highest amount of domestic travel.
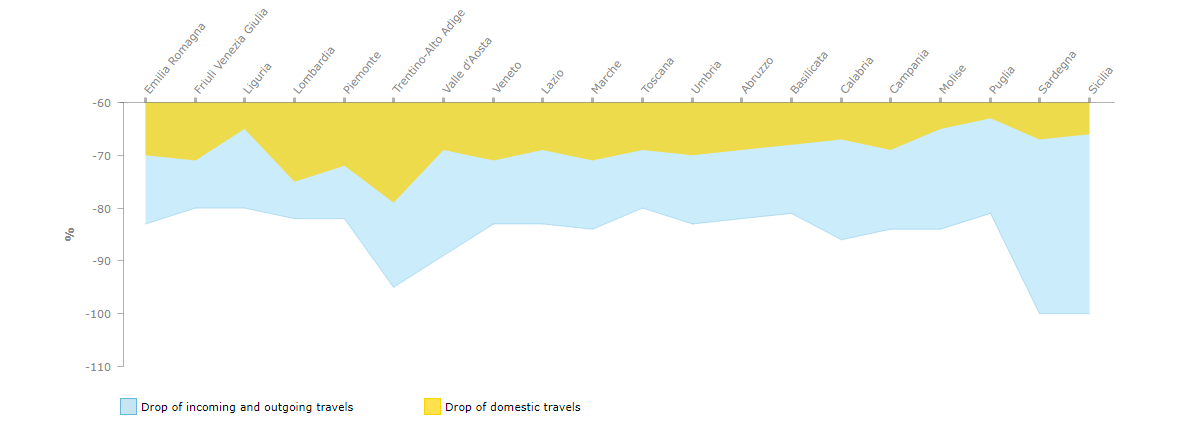
Drop of domestic vs. incoming and outgoing travels during the Lockdown
The Phase 2
Mobility patterns during the Phase 2
Even though the majority of travels remained within the boundaries of regions, the number of interregional trips is revitalising quickly during Phase 2. For instance, the substantial upturn is observed in travels between Piemonte and Lombardy. Less prominent, but still significant, is the increased number of trips between Campania and Lazio.
Phase 2 brought positive shifts towards the normalisation of everyday activities, in which the mobility has doubled. With further relaxation of strict measures, reopening of kindergartens, full-time working schedules, and especially after June 3rd when unrestricted travel restarts, it’s expected to see even more prominent mobility throughout the country. Needless to say, increased mobility will be one of the crucial signs of a much-needed economic regrowth. As per the latest OECD predictions, Italy will, from the consequences of the unprecedented health crisis, among the UK, France and Spain, experience 11% drip of GDP in 2020 (Eurozone average is -9%). Regarding tourism, travel industry experts expect it to resume slowly and with road trips not too far from home.
To the interested reader
The comprehensive analysis of the effect of COVID-19 on mobility, including the drop of circulating vehicles, average daily drives, changes in driving on highways, urban and suburban roads, and speeding patterns, is available in the e-book format.
This is the actual SQL query which we have executed against SpaceTime to generate origin-destination analysis. SpaceTime executed the query against 51 Billion records in a 2.5TB spatiotemporal database in just 11 seconds (note the spatial operations in the query which are typically considered as an “Achilles heel” of relational databases). The database for this analysis was deployed on a cluster of 6 identical physical servers. All servers are equipped with a single Intel® Xeon® CPU E5-2687W v2 CPU clocked at 3.40GHz, 64 GB RAM, and single consumer-grade NVMe disk with 1TB storage space. To prove the cost-effectiveness, we've bought all of them refurbished on bargainhardware.co.uk for about 500$ each.
			select p1.name, p2.name, count(*)
			from st.trips
			join ndb.polygon p1 on ST_Contains(p1.points, ST_Point(x0, y0))
			join ndb.polygon p2 on ST_Contains(p2.points, ST_Point(x1, y1))
			where t[0] >= ts('2020-02-04 01:00') and t[0] < ts('2020-02-11 01:00')
			group by 1, 2