When you’re stuck in a traffic jam, many things might come to mind - eg. Why is this happening?
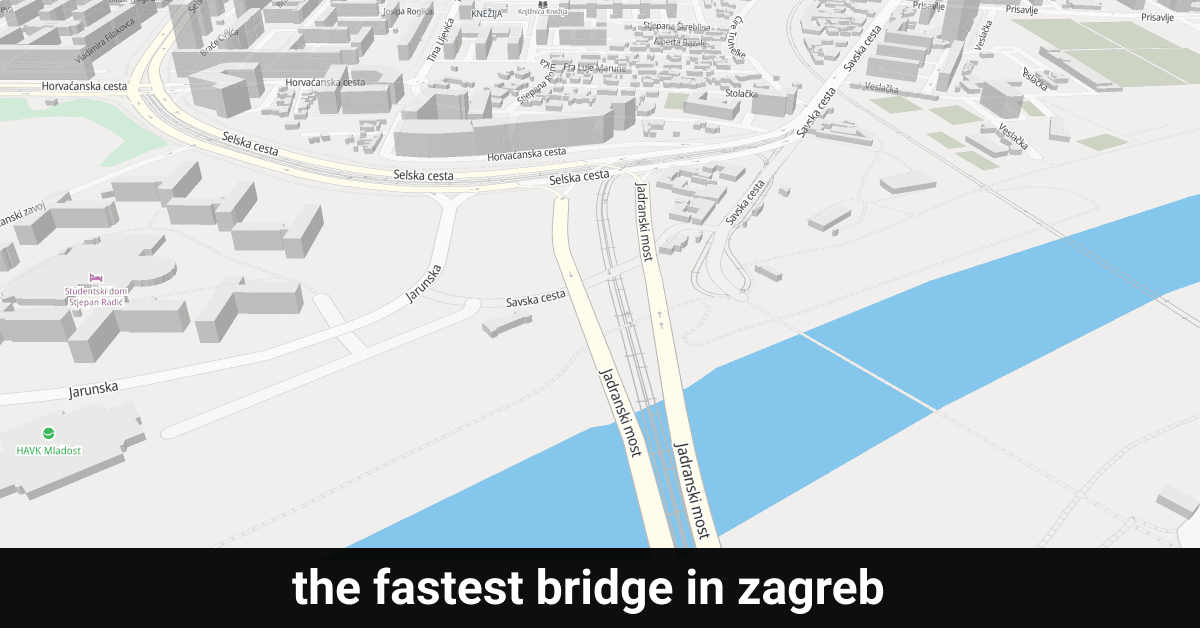
This article is part two of our traffic analysis across the three main Zagreb bridges - The fastest bridge in Zagreb. However, coming September, the traffic patterns have dramatically changed. Continue reading to discover what changed and which bridge is now the fastest!
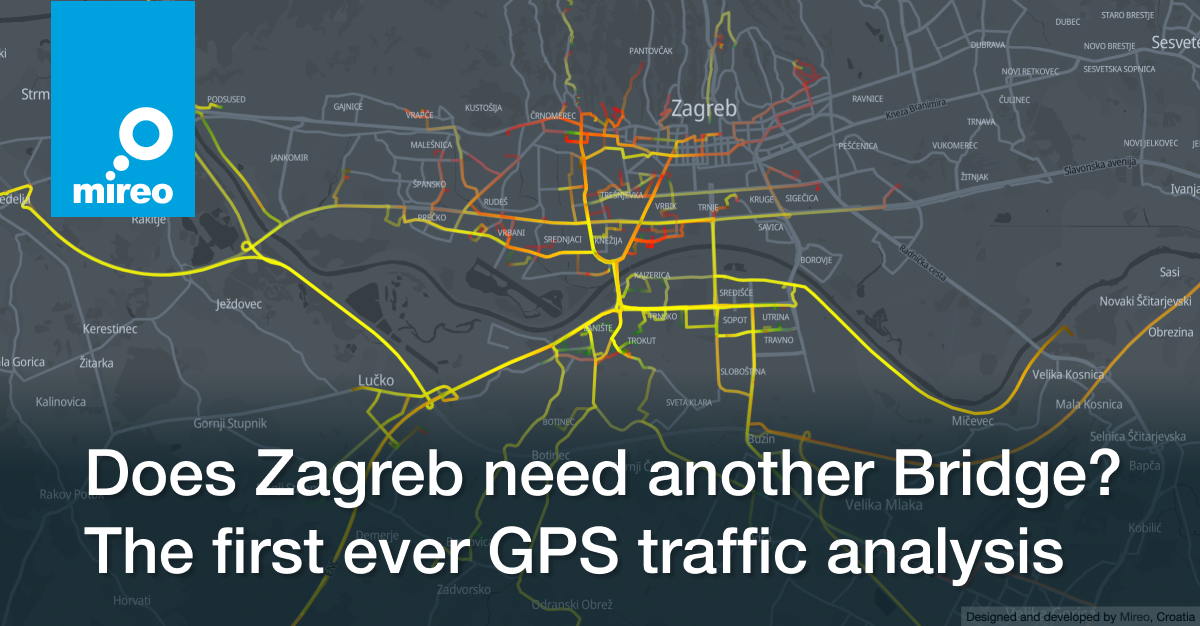
Initially, we wanted to test the general public’s knowledge of the traffic in Zagreb. Since people’s opinions (spoiler alert) tend to be biased, we keep the analysis objective using historical GPS vehicle data.
The historical GPS driving data used was collected from the mixed-typed vehicles from the proprietary GPS tracking solution. Using SpaceTime Roadway Analytics, we’ve precisely matched the vehicles’ GPS data to the road network and reconstructed vehicles’ speeds. Finally, we measured the speed fluctuations in 15 minutes timespans during workdays. It can’t go any more accurate, agree?
Up to March 2020, just like everywhere else in Europe, morning and afternoon rush hours were quite noticeable.
Then, due to the pandemic preventive measures, many people started working remotely, and traffic jams vanished entirely. Only to start appearing again a few months later.
Until September 2021, morning traffic was relatively mild, shifting more towards the mid-day and the afternoon. Only afternoon traffic jams were still frequent. This behavior precisely matches the post-pandemic traffic in other European countries.
Starting from September 2021, the traffic slowed down dramatically, which is why we’ve decided to revisit our analysis.
We’ll visualize the traffic patterns across the three central bridges in Zagreb, find the exact timings when the traffic jams occur on each bridge, determine which bridge is the fastest one, and discuss possible causes of the congestions.
To preface, the city of Zagreb is built around the Sava river, which splits the city into the Northern and Southern parts. Southern Zagreb is a predominantly residential area, while the northern is a business/administrative area. Therefore, due to everyday commuting, the traffic towards the North is generally much heavier in the mornings and vice versa in the afternoon hours.
As per our previous analysis - before September 2021, morning traffic jams were much milder than afternoon ones. Moreover, there were no traffic jams on Mladost bridge, despite it previously being infamous for its morning jams!
Average speed across Zagreb bridges, Spring 2021, direction North
The battle for the slowest bridge is still tight between Jadranski and Sloboda bridge.
Coming September, morning jams started as early as 7:00 and lasted until 8:45, compared to 7:15 - 8:00 during spring! The average speed dropped to the 15 - 20 km/h range, compared to almost 30 km/h during spring.
Afternoon jams also last longer and now occur between 15:00 and 17:45, compared to the 15:15 - 17:15 timespan in springtime.
Average speed across Zagreb bridges, Fall 2021, direction North
The Mladost bridge paradox
The biggest surprise is the return of the infamous Mladost bridge morning jam back in its full glory with an average driving speed of only 15 km/h.
In contrast to its slow morning traffic, with the 70 km/h average driving speed, the afternoon traffic on the Mladost bridge is blazingly fast!However, don’t be fooled by the fast traffic: the traffic jams at the Držićeva-Vukovarska intersection, which follows the Mladost bridge, annul a large chunk of the saved time.
Average speed profile Zagreb Mladost bridge - Vukovarska intersection, Fall 2021, direction North
The congestion-free Mladost bridge
The Mladost bridge is again by far the fastest. Morning traffic is almost non-existent, and afternoon traffic is only slightly slower.
The afternoon congestion observed during springtime vanished almost entirely, which correlates with the reopening of the 3rd lane after the extensive bridge reconstruction.
Longer afternoon jams
Both morning and afternoon traffic across the central Sloboda bridge remain unchanged. Traffic is slightly slower in the morning, making it the second-best option to cross the river. But the afternoon traffic jam remains strong.
On both, Jadranski and Sloboda bridge, afternoon jams last longer - from 15:00 until 17:45, compared to to 15:00 - 17:00 during the springtime.
Average speed across Zagreb bridges, Spring 2021, direction South
Average speed across Zagreb bridges, Fall 2021, direction South
Deceivingly, no congestion on the Jadranski bridge
Strictly speaking, when traveling south, traffic jams do not occur on the Jadranski bridge. That’s because the congestions occur otherwhere.
Firstly, the congestion occurs on the entry segment of Selska street. Then, traffic slows down again right after the bridge, on the entrance to the rotary, when traveling towards Novi Zagreb. This second congestion is caused by the short traffic lights cycle on the rotary’s entry.
Many would argue that the newly rebuilt rotary on Jarunski bridge didn’t increase the traffic flow. However, due to the high number of traffic incidents occurring on the old rotary, the main goal of the new one was to increase safety. Regarding the traffic improvement, at least the east-west traffic towards the highway is happening in the subway and remains unobstructed by the traffic light signalization.
During springtime of 2021, morning traffic was faster, and congestion occurred almost exclusively during the afternoon.
The resurgence of morning traffic jams marks the beginning of autumn of 2021. Not only do the morning jams last longer, but the traffic is generally much slower.
Traditionally, traffic jams surge as schools reopen in the fall, and this year was no exception. However, the reopening didn’t have such a prominent effect in September 2020, which leads us to suspect that the number of remote workers has dropped drastically.
Check The fastest bridge in Zagreb if you're interested to read the first part of this traffic analysis.
If this topic intrigued you and you want to discover further connected car data applications in smart city solutions, make sure to explore the SpaceTime Interactive Demo.
The interactive demo portrays how innovative and agile city governments can utilize connected car data in revealing and improving traffic intensity, traffic patterns, speeding hotspots, and many others.
This analytics is made using Mireo SpaceTime Roadway Analytics.We took historical GPS driving data from vehicles of mixed types from the proprietary GPS tracking solution, matched them precisely to the road network, and precisely reconstructed their speeds.
This is the actual SQL query which we have executed against SpaceTime to generate the average speed data. SpaceTime executed the query against 15 billion-record table in just few seconds (note the spatial operations in the query which are typically considered “Achilles heel” of relational databases).
select
TO_CHAR(ds::timeperiod, '%H:%M') as hour, 3.6 * av as speed
from (
select
((t[0]::int64 - TS_TRUNC('day', t[0], 'Europe/Zagreb')::int64) / 900 ) * 900 as ds,
sum(SPHERE_LENGTH(x[0], y[0], x[1], y[1])) / sum((t[1]- t[0])::int64) as av
from st.segments
where
ST_Intersects(
'POLYGON (({poly}))'::polygon,
ST_Line(x[0], y[0], x[1], y[1])
)
and t[0] >= ts('2021-09-06', 'Europe/Zagreb')
and TS_EXTRACT('dow', t[0]) between 1 and 5
and TS_EXTRACT('hours', t[0], 'Europe/Zagreb') between 5 and 20
group by 1
)