Mireo's approach
With a little bit of help from telematics, let's see how motorists behave in other cities, specifically in Zagreb where we have a statistically significant sample of mixed-type vehicle data.
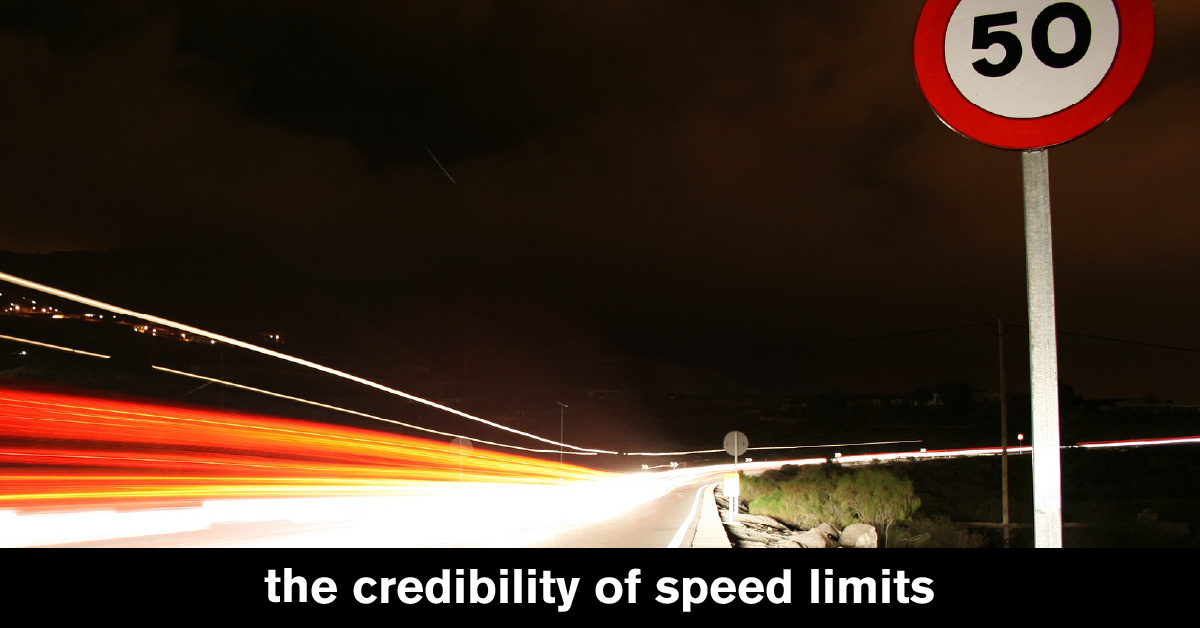
We chose to use the telematics data to deliver fast and precise insights about real-world driving patterns near cameras and how motorists obey speed limits. Such information is traditionally entirely disguised behind the police records when evaluating the safety benefits of speed cameras.
How telematics-driven data can help cities in better placement and utilization of speed cameras
We observe the motorists' behavior when passing by six fixed speed cameras placed in high-traffic locations. The goal is to show how telematics-driven data can help cities in better placement and utilization of speed cameras.
Using Mireo's SpaceTime Roadway Analytics, we observed the proportion of speeding motorists on approximately 200-300 meters long segments before and after the fixed-speed camera over a three months-long period. Only motorists driving at least 10 km/h above the speed limit were considered to be speeding. To give a better perspective about typical driving speeds, we've analyzed the speed distributions on segments before and after the speed cameras (the proportion of vehicles driving at certain speeds).
As it will turn out, in 6 out of 6 observed locations, up to 4 times more speeding events occur after the speeding camera. The extent of speeding, combined with surroundings and corresponding traffic incidents records, could be a strong indicator of camera review.
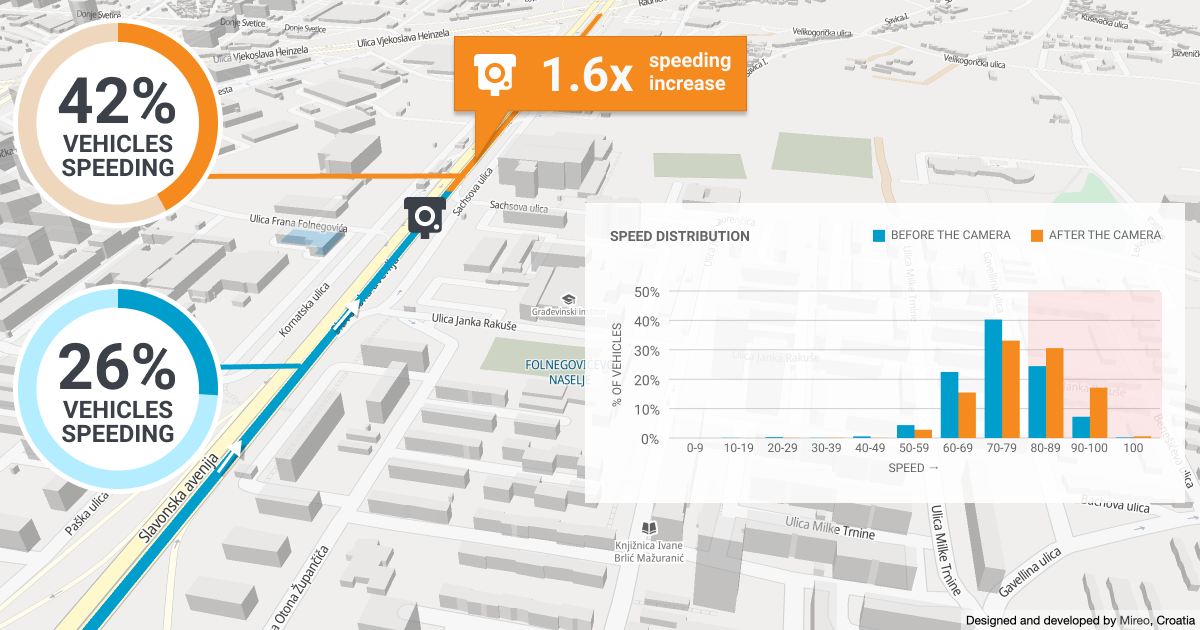
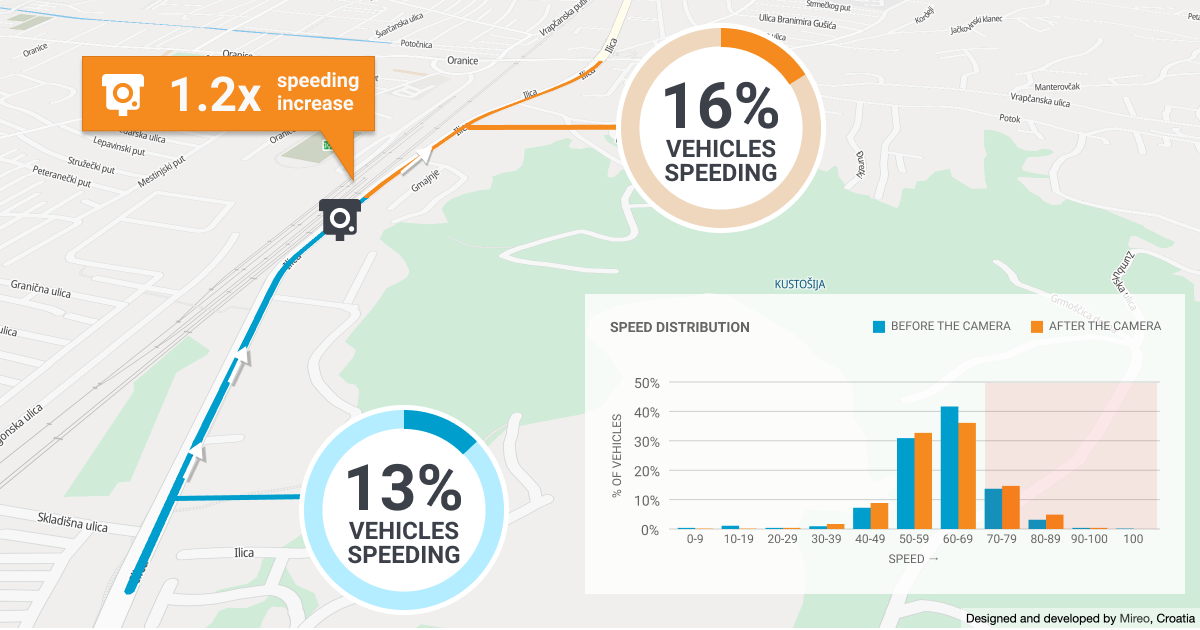
Vjesnik speed camera
Zagreb Vjesnik speed camera review
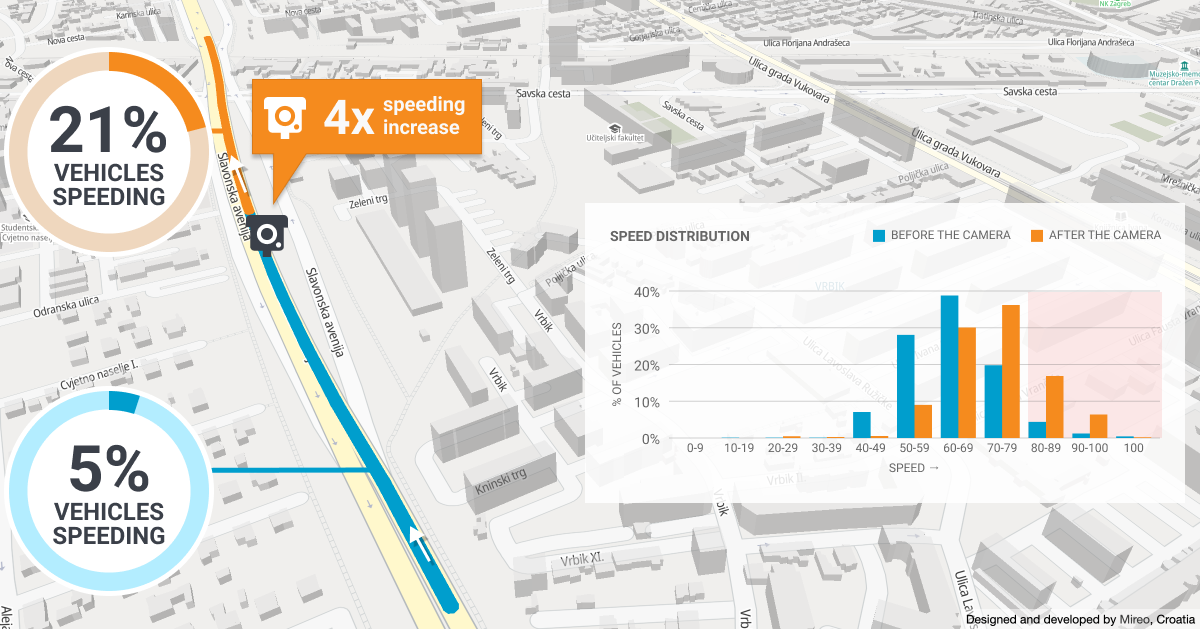
The Vjesnik fixed-speed camera is installed on, by far, the busiest road in Zagreb - Slavonska Ave, next to the legendary Vjesnik skyscraper and just before the entrance to the subway. The speed limit on this 3-lane, straight road is standardly set to 70 km/h.
The data reveals that the motorists tend to speed strikingly 4x more after passing by the camera than they typically do before the camera - that's 21 % vs. 5 % of motorists.
Moreover, observing the speed distribution, motorists drive significantly slower and very much adhere to the speed limit on the segment before the camera - typically between 40 and 70 km/h, compared to 50 - 80 km/h speeds after the camera. The lower travel speeds on the before segment are most likely caused by the closeness of the nearby intersection, placed just 500 m before the camera. Conversely, the downhill segment after the camera amplifies the travel speeds, making the difference between speeding even more prominent.Drziceva speed camera
Zagreb Drziceva speed camera review
The fixed speeding camera on Drziceva Street is installed on a high-traffic road leading to one of the three main city bridges. The speed limit on this 3-lane, straight road is standardly set to 60 km/h.
On the segment before the speed camera, 21 % of the motorists are speeding at least 10 km/h above the speed limit (driving above 70 km/h), compared to 41 % of motorists speeding after passing the camera - or twice as more.
Even observing the typical speed distributions, motorists drive significantly faster after the camera - between 50 and 80 km/h range, compared to 50-70 km/h speeds before the camera.
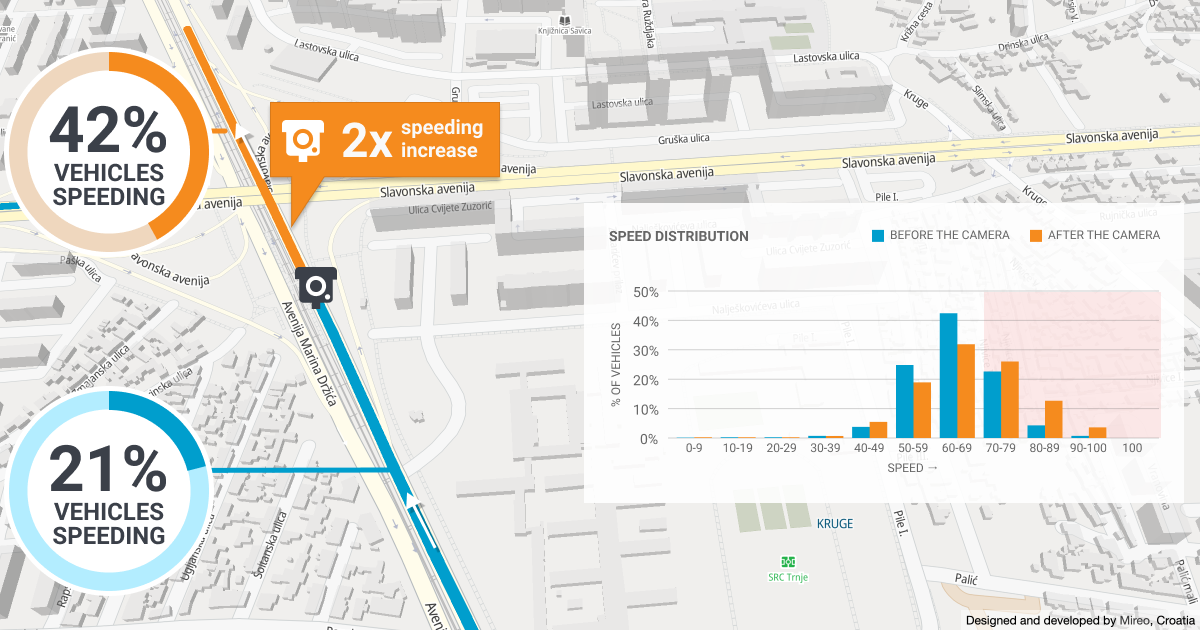
Slavonska speed camera
Zagreb Slavonska speed camera review
Given the surroundings, this is probably one of the most thoughtfully placed cameras in the city. It's placed far enough from the surrounding intersections, on a long, straight, 3-lane road segment with a 70 km/h speed limit.
The wide, long road proves to be alluring to push the pedal, 1.6 times more motorists speed after passing the camera - 42 % vs. 26 %.
Moreover, observing the speed distribution, it's evident that motorists drive faster after passing the camera - the proportion of motorists driving above 80 km/h is significantly higher.
Bologna Ave speed camera
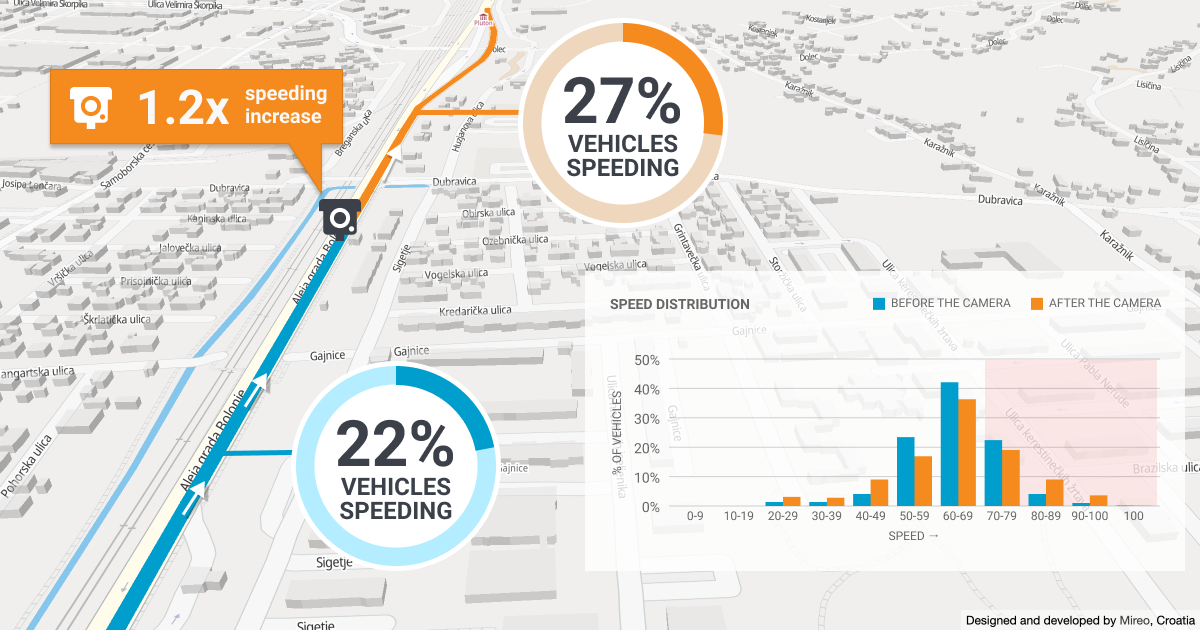
Zagreb Bologna Ave speed camera review
Placed also on a straight 3-lane road with a 70 km/h limit also shows the trend of slower driving speeds before the camera. Approximately, vehicles are speeding 1.3 times more after the camera.
Zagreb bypass speed camera
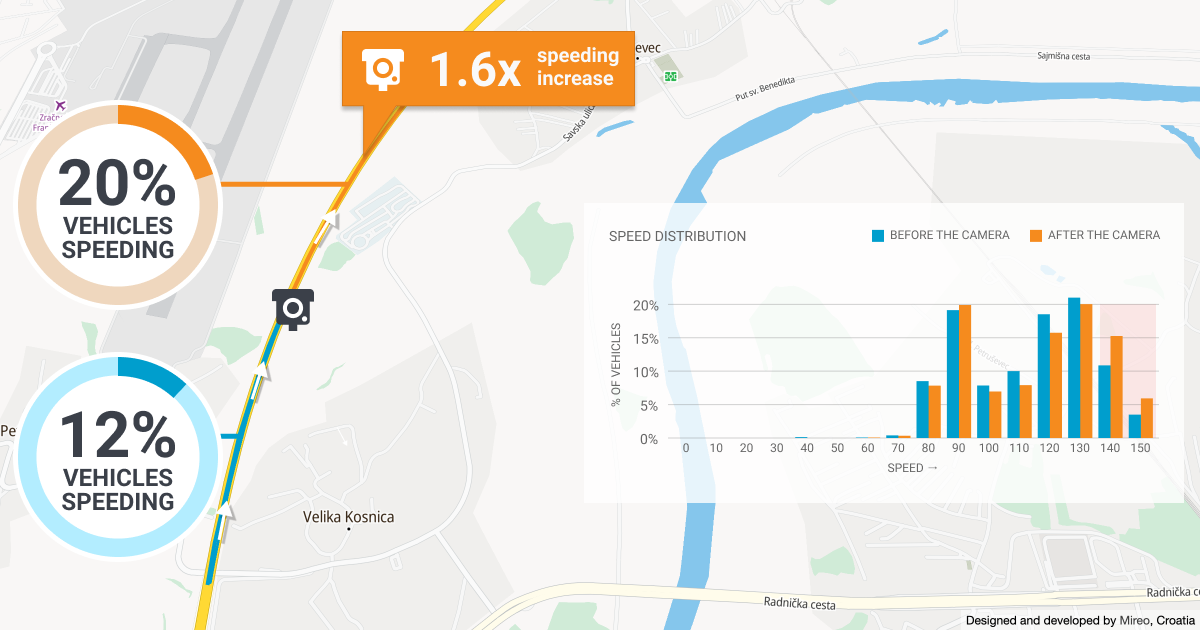
Zagreb bypass speed camera review
The speed limit on the Zagreb bypass is set to 130 km/h. Despite the generously set speed limit, 12 % of motorists still disobey the law while approaching the camera. 1.6 times more drivers (19 %) push the pedal after passing the camera.
As expected, fairly larger proportion of motorists drive above 140 km/h after passing the camera.
Ilica camera
Zagreb Ilica speed camera review
The speeding camera on Ilica Street is the most recently installed one, after the horrifying traffic accident caused by reckless 150+ km/h driving in this 60 km/h zone.
The extent of speeding after the camera and increase in driving above 70 km/h is somewhat lower compared to other locations, probably due to the nearby signal-controlled intersection.
Given the observed behavior, drivers unquestionably tend to slow down for the sole purpose of not being caught by the camera.
However, according to the Australian speed camera review reports, speed cameras are proven to reduce the incidence of crashes, injuries, and fatalities when placed correctly. Criteria used to select fixed speed camera location typically include casualty rate, crash rate data, and speed surveys to identify the percentage of speeding vehicles.
Unlike the speed surveys, the telematics data provide precise insights into identifying the speeding frequency on different road segments, making camera placement more deterministic.
Traditionally, to retain positive safety effects, speed cameras are reviewed yearly. Reviews typically include a comparison of police records of traffic incidents before and after the camera installation. Telematics data offer fast and immediate insights about real-world driving patterns near cameras and how motorists obey speed limits, something entirely disguised behind the police records.
If this topic intrigued you and you want to discover further connected car data applications in smart city solutions, make sure to explore the SpaceTime Interactive Demo.
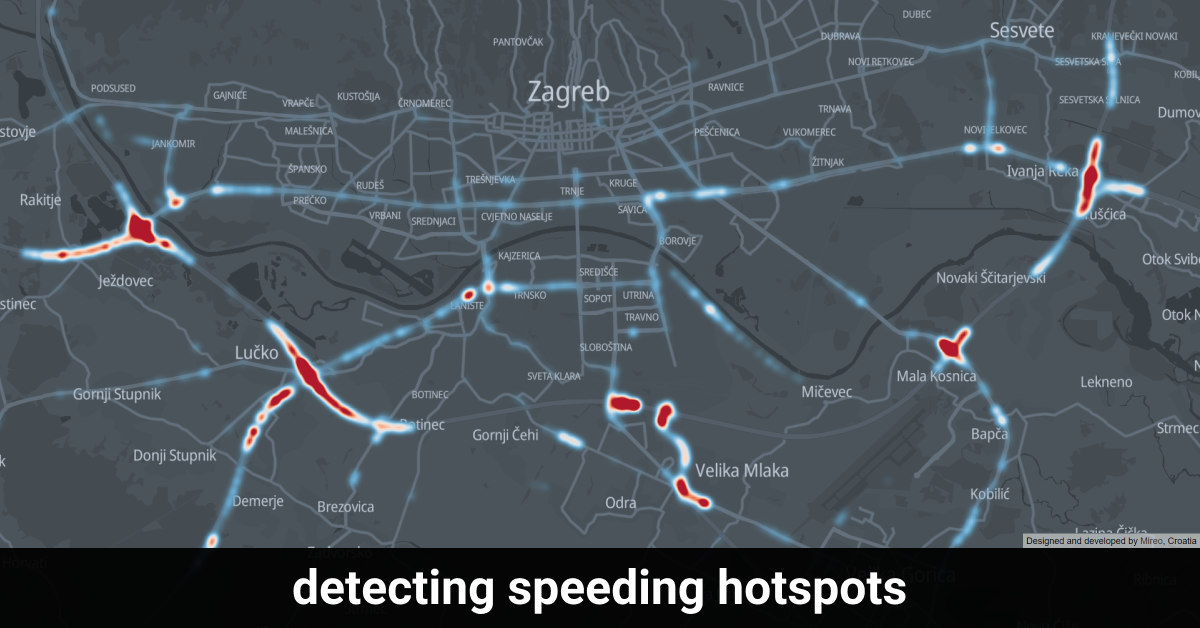
The interactive demo portrays how innovative and agile city governments can utilize connected car data in revealing and improving traffic intensity, traffic patterns, speeding hotspots, and many others.