If we have data, let’s look at data. If all we have are opinions, let’s go with mine.
James L. Barksdale
Ever since the first breakthroughs in SpaceTime, we wanted to explore how to utilise abundant amounts of moving objects data on an entirely new level. As a notable fleet tracking solution provider, we had a decent amount of vehicles’ GPS traces to start from. We imported that data into SpaceTime and started answering every fleet tracking related question we’d ever received.
Soon, we started joking with funny questions like:
- Which vehicles passed next to our office this morning?
- Do clients’ drivers meet for a coffee break during working hours?
- Are others speeding too and where?
With each improvement in SpaceTime query engine and its performances, more and more doors started to open. However, the speeding was particularly interesting to us.
Our previous fleet tracking solution wasn’t able to compare the actually driven and the posted speed limits due to its technical limitations, although it heavily relies on the map data. With SpaceTime and improvements in high-precision path reconstruction, we’ve introduced the speed interpolation model. Speed interpolation was something we considered to be crucial in a more sophisticated GPS traces analysis.
On top of that, since map data compilation was always a part of our business portfolio (Mireo was the first to build a digital map of Croatia), we decided to fuse underlying map data with GPS reconstructed paths. In terms of use, it enabled us to inspect the correlation between vehicle routes and posted speed limits, road types, area hierarchy etc.
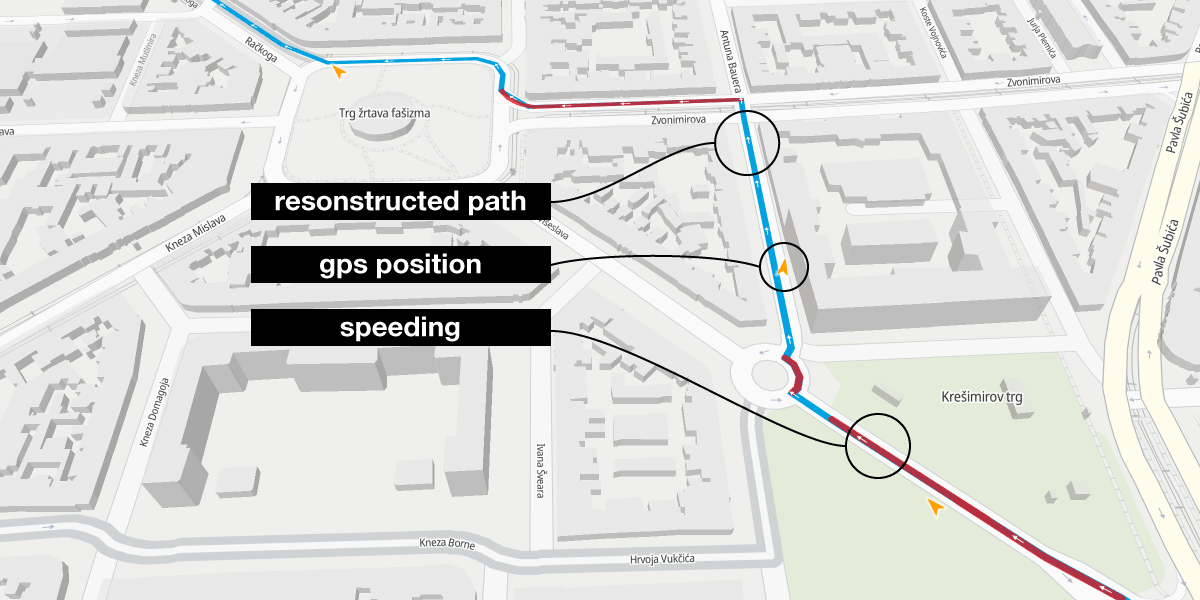
Vehicle path reconstruction from sparse GNSS probes to continuous trajectory
Having all those tools at our disposal, we questioned the credibility of posted speed limits. As drivers, we had the impression that speed limits were sometimes set too low on particular road segments. We wanted to run an analysis that would illustrate locations in which the majority of drivers’ speed was above the speed limit and the amounts of over speeding. Specifically, we were looking for locations in which speeding happens the most and how commonly speed values at those locations compared with the posted speed limits.
Methodology
We took historical driving data from vehicles of of mixed type from our proprietary GPS tracking solution from the beginning of the 2019, focusing analysis on Zagreb and Rijeka areas. Vehicles’ speeds and trajectories were precisely reconstructed to the exact road network.
Having exact trajectories and speeds, we ran analysis to identify locations (road segments) in which drivers were speeding at least 20% above the posted speed limit. From this set of results, we extracted 5% of locations with the highest number of speeding events. And this enabled us to determine locations at which majority of drivers don’t obey speed limits.
To an interested reader: while driving, vehicles are sending their GPS positions every 100m to SpaceTime system. SpaceTime reconstructs vehicles’ trajectory and speed with 99.9% accuracy (sometimes GPS is simply not accurate enough). We then compared actual driven speed and posted speed limit on small 60m road segments to be able to cluster them together. Then we counted the number of speeding events on each of such segments to identify those with the most of them. Specifically, we identified 60m road segments with the number of speeding events in the last 5th percentile. The exact SQL query executed against SpaceTime database is given in the appendix.
Results
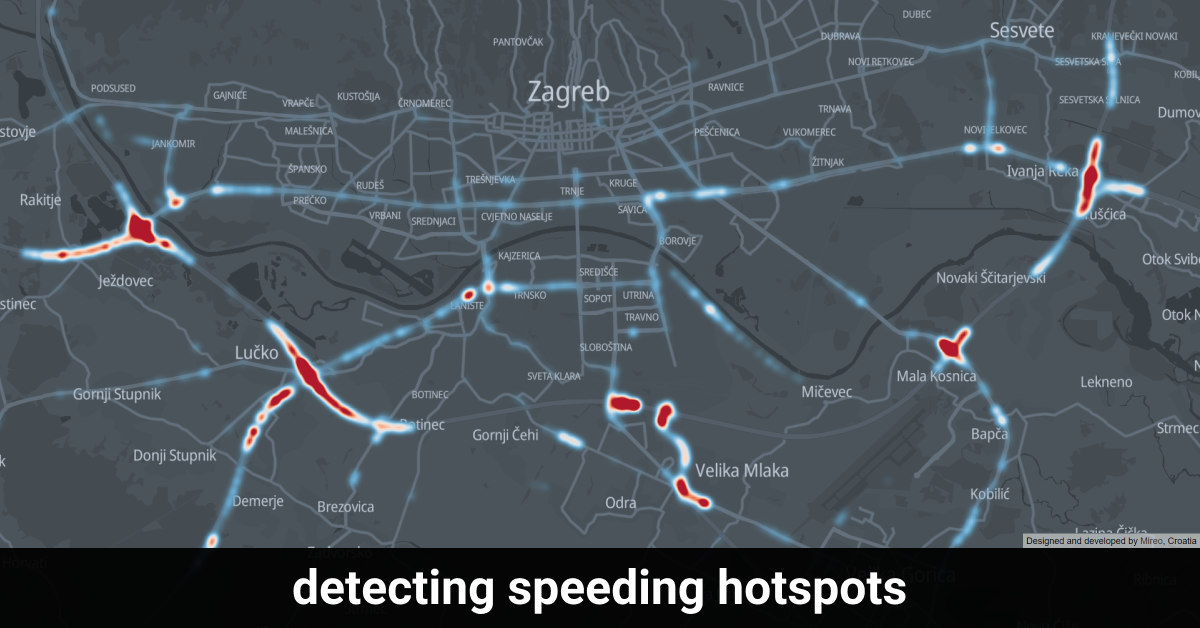
The analysis identified the top 5% locations of most frequent speeding above 20% of posted speed limits in Zagreb and Rijeka areas. For the sake of relevance, only last year of data was observed. During this one year timespan, exactly 10.328.921 km and 5.382.877 km were driven in these areas, confirming the credibility of the data sample.
We displayed locations with the most speeding events on the map using 3D bars where the height of the bar represents relative number of speedings at a particular location, and the colour indicates speed. The map of locations with the most speeding events for Zagreb looks like this:
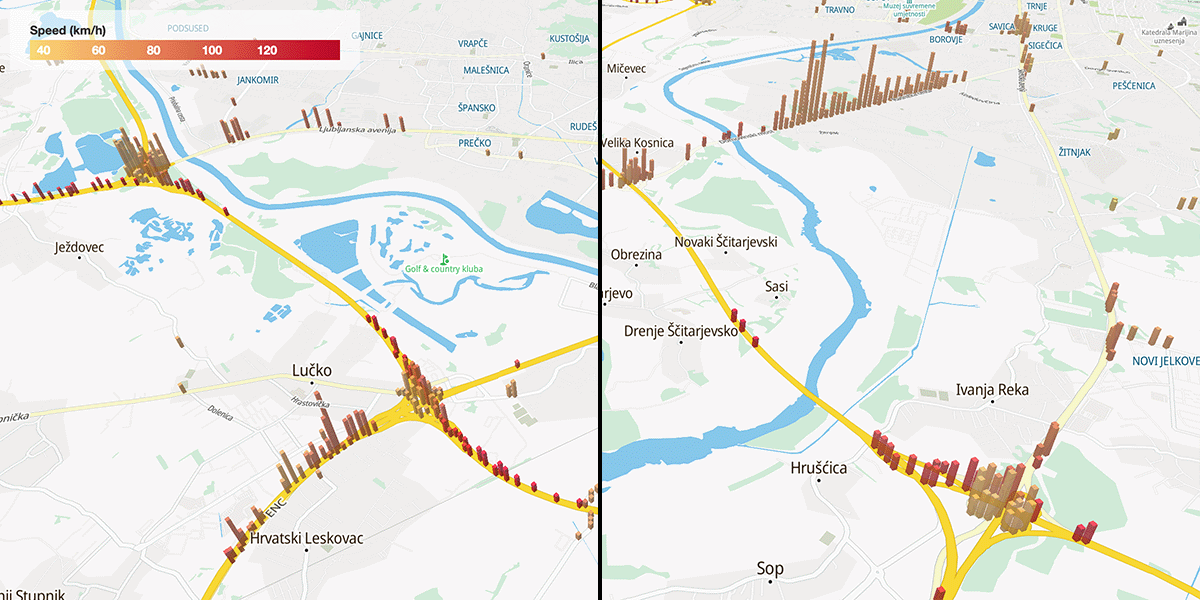
Surprisingly, locations with the highest number of speeding events are on high-speed motorway interchanges. Other interesting locations were A3 high-speed motorway segments between Lučko and Botinec, Jankomir and Sveta Nedelja, as well as on Radnička Street.
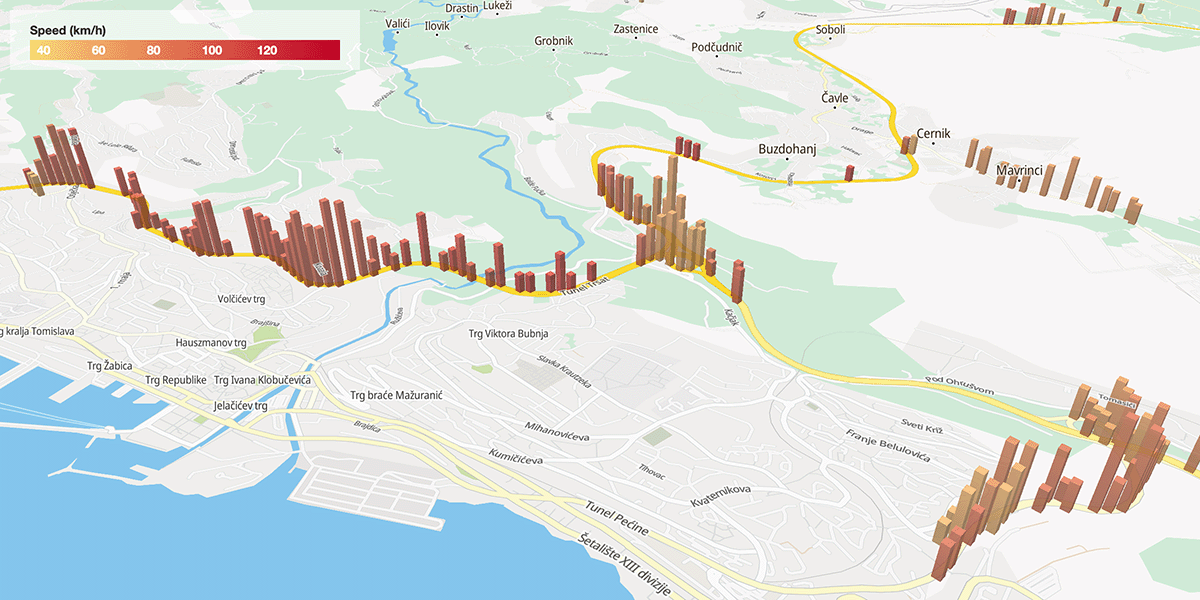
In Rijeka, particularly interesting were the amount and intensity of speeding on A7 motorway segment between Orehovica and Rujevica interchanges:
In both cases (Zagreb and Rijeka) most people don’t obey speed limit at highway intersections. There are also clearly identified streets at which speed limits are set too low, at least according to the opinion of the majority of drivers.
Why is this happening? Why do people routinely drive above the posted speed limit at those locations? Are those speed limits set only because authorities want to predictably collect speeding fines? Or is there some other, more legitimate explanation? We did some research and what follows are our findings on the topic.
Speedings at motorway interchanges
Some countries, e.g. USA, consider highway ramps to be too short in a distance to enforce speed limits while some US states provide only advised speed limits. Croatian law, on the other side, imposes 40 km/h speed limit on highway ramps and 130 km/h on highways.
Therefore, drivers merging or exiting highways have to significantly slow down to obey the speed limits. Particularly affected are drivers who change directions as they need to slow down considerably on an interchange, and accelerate to 100+ km/h immediately after that in order to merge safely onto a highway.
By Croatian law, high-speed motorways are defined as roads with at least three lanes per direction, with the reserved area separating opposite lanes. The most common speed limit is 130 km/h. Minimal highway lane width is 3.75m, but highway interchanges tend to be even wider because of the fewer number of lanes on the same surface. Also, almost all interchanges and rest areas on highways are illuminated and provide excellent visibility. To be precise, only Jastrebarsko interchange is not illuminated.
Regarding the quality of Croatian road network, 70% of highways have been built during last 20 years and they are relatively new and of excellent quality. Moreover, by the WEF’s Global Competitiveness Report, Croatia has been worldwide listed as the number 13 in quality of road infrastructure. Therefore, the highway road quality in Croatia is actually excellent and “unreasonable” speed limits on highway interchanges are not a consequence of bad road surface or bad visibility.
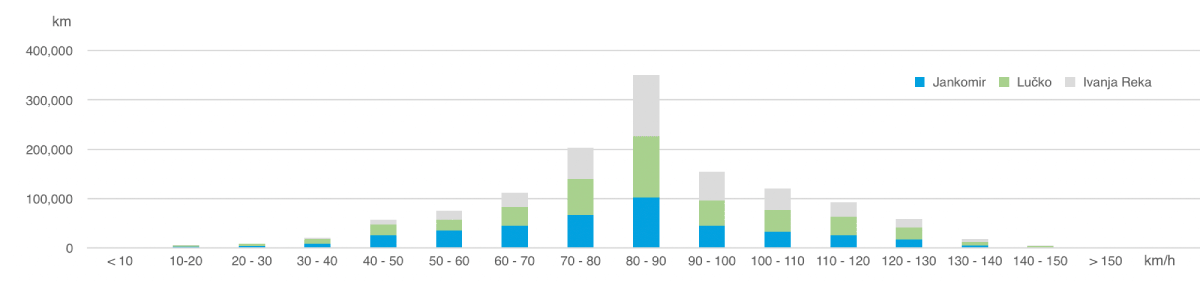
Let’s analyse in more depth the speeds at three highway intersections in Zagreb - Jankomir, Lučko and Ivanja Reka. Our analysis showed that, in reality, 80% of kilometres driven on these three interchanges were at speeds above 60 km/h (Ivanja Reka 92%).In other words, only every fifth kilometre was driven below 60 km/h, which is still 20 km/h above the posted speed limit.
On top of that, the most common speed range is 80-90 km/h, with more than 25% of total distance driven. Closely followed are 70-80 km/h, 80-90 km/h and 90-100 km/h ranges with 10-15% distance driven ratio.
The complete speed distribution is displayed in the following chart:
Although these numbers were compared on the entire interchanges, and include not only ramps but also straight parts, they still give a very good insight on the real-world driving speeds and the disproportionality of speeds at different segments.
For a reference, from 10 million kilometres of drives within Zagreb area, 1.2 million kilometres were driven on those three interchanges alone, pointing to the importance and the intensity of traffic flow. The data supports the general belief that the posted speed limits are set unreasonably low for such good traffic conditions. The majority of drivers don’t consider these limits logical.
With that in mind, let’s illustrate how research data support such low posted speed limits on highway ramps.
In the Motorways 2018 document, German Research Association for Road and Traffic, FSGV, advises interchange design to be focused more on a gradual change in driving behaviour, in order to adapt to the modified characteristics and to gradually reduce or increase speed.
American Association of State Highway and Transportation Officials, AASHTO, states that the greatest efficiency, safety and capacity are attained when the intersecting travelled ways are grade-separated.
Swedish Institute for Road Safety Research considers that the effects on safety depend on the extent to which drivers are surprised by the traffic congestion, indicating that sudden changes in speed might have a negative impact.
According to ERSO Traffic Safety Synthesis on Speed and Speed Management (2017), accidents on motorways due to speed tend to be more severe, but overall in Europe, they correspond to 7% of total road fatalities. It is interesting to point out that the highest percentage of fatalities occurs in the 25-49 age group, combined with accidents caused by improper use of emergency lanes, head-on accidents and wrong way-driving.
Zagreb bypass between Lučko and Botinec
On Zagreb bypass, a part of A3 high-speed motorway, between Lučko and Botinec the posted speed limits are set to 100 km/h. Such abrupt change in speed doesn’t reflect the road conditions. Although a bypass road, it is constructed as a full high-speed motorway with 3 lanes with a green divider separating the opposite directions.
Although the most common speed range is 80-90 km/h with 35% of total mileage driven, 43% of the road segments were driven at speeds above 100 km/h.
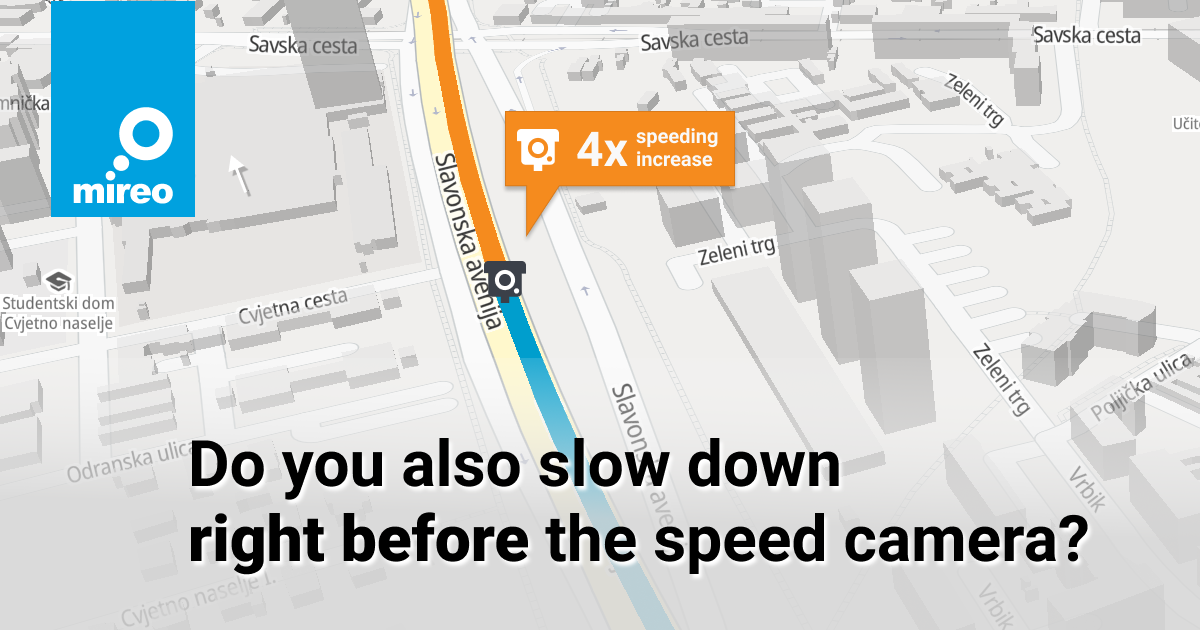
Radnička street
Radnička street, the segment between Slavonska Avenue and Domovinski Bridge, is an example of the recently reconstructed, straight, bidirectional 3-lane road, located in the industrial area. Lanes are separated with a green belt divider.
The final reconstruction phase was completed in 2018, aiming to support an estimate of 15% of all vehicles entering Zagreb, as well to facilitate the connection with Zagreb Airport. After the reconstruction, the speed limit was increased from 50-60 km/h to 60 km/h in full length, still under the guidance of speed limits in built-up areas. Police patrols measuring speed were common throughout the road.
The latest data show that the majority of drivers are speeding throughout the entire segment. Especially during weekends, when the traffic is light, almost 50% of drives were driven at speeds above 65 km/h. With overall excellent road conditions, in terms of quality and visibility, the speed limits on this road segment could be increased, assuming that police reports present insignificant number of accidents.
Regarding the impact of the speed increase to air pollution, 2008 study found that the relationship between speed and CO2 emission is not perfectly linear, but a parabolically-shaped curve with a minimum at 72-80 km/h speed. CO2 emissions increase dramatically when average speed dips below 72 km/h and goes above 96km/h, indicating a golden zone between 72 and 96 km/h. Increasing speed limit to fit this golden zone range, assuming it could be maintained most of the time, would have a direct positive effect on the traffic flow and it would indirectly benefit to CO2 reduction.
Latest update: Starting from December 2019, the city government increased speed limit to 70 km/h on the majority of the road. As per our analysis, this speed reflects real-world situation.
Rijeka bypass
A7 motorway segment (Rijeka bypass) was reconstructed and opened for public in 2009 as two-lane expressway with grade separated intersections. To this day, it is known for its strict speed restrictions.
To be precise, there are 21 different speed limit signs placed on this 8 km long segment. Due to the mountain terrain and impaired road visibility, Directorate for Transport Inspection’s guidelines were to lower the speed limit between 60 and 70 km/h, depending on the segment.
These regulations tend to be a common subject of debates for the past 10 years since general belief is that the motorway allows significantly higher travel speeds, mentioning that the majority of the local population actually travels at speeds between 80 and 90 km/h.
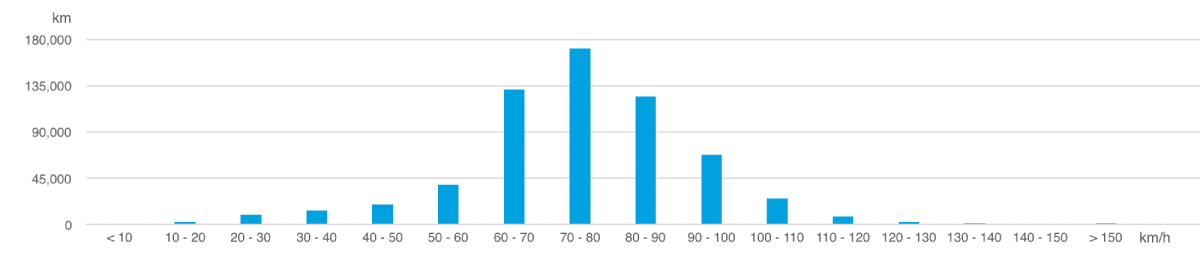
Our analysis indicates that speeding occurs on the majority of Orehovica-Rujevica A7 segment. The most frequent speed values are between 84 and 108 km/h. To get a better insight on typical speeds on this segment, we analysed speed distribution.
Precisely two thirds (2/3) of this segment were driven at speeds above 70 km/h. Moreover, 70-80 km/h was identified to be the most common speed range (27%), measured by distance driven. 60-70 km/h and 80-90 km/h ranges are the next most common speeds with 20% distance ratio.
These numbers correspond to the above mentioned general belief that vast majority of population travels faster than speed limit and that speed limits might be set too low.
Particularly interesting was the 10% ratio of drives in 90-100 km/h range:
Conclusion
The analysis on historical vehicles’ trajectories clearly showed that there are particular locations in Croatia where a vast majority of drivers do not obey speed limits. In fact, in some cases, most drivers actually drive much faster than speed limit. In other words, the majority of drivers consider these speed limits “dishonest” or just plainly wrong.
For completeness, we’re listing here a few relevant general principles which authorities should be using to set speed limits on roads. The final conclusion is left to you.
Speed limits and design speed
A widely accepted definition of the design speed is the highest speed that can be maintained safely and comfortably when traffic is light. During road modelling, the design speed is used as an input to determine necessary geometric design features. If higher speeds are desired, road quality and roadside protection must obey appropriate standards. For credibility reasons, the design speed must not be lower than the posted speed limit.
Moreover, consistent design speed is preferred to be maintained over longer road segments. Otherwise, to support significant design speed reductions, speed limit signs need to be accompanied with additional warning signs.
Principle of credibility
Speed limits need to be credible, meaning that the posted speed limits should be considered logical to the majority of drivers. The principle of credibility implies that speed limits need to reflect safe speed for the particular road characteristics, such as design, function, and environment. Most common examples where posted speed limits are considered dishonest are:
- Speed limits indicating built-up areas in a distance which is too big
- Same speed applied for different road geometry (winding vs. straight roads)
- Poorly communicated reasons for lower speed limits (safety, noise reduction, pollution)
V85-speed
One of the most favourable approaches in the determination of most appropriate speed limits is 85th percentile speed or V85. It is a speed below which 85% of vehicles operate under free-flow conditions on clean and dry pavements. This value is considered to be a truer measure of drivers’ behaviour.
SafetySafety is the number one reason to enforce speed limits because speed directly correlates with the severity of injuries in traffic incidents. However, speed limits affect mobility and economics (travel time) and environment (noise and air pollution). A much broader picture should be considered when setting appropriate speed limits and the optimal value is, in the end, a political decision.
Appendix
This is the actual SQL query which we have executed against SpaceTime to generate speeding data displayed with 3D bars on the map. SpaceTime executed the query against 15 billion-record table in just few seconds (note the spatial operations in the query which are typically considered “Achilles heel” of relational databases).
		with
		speedings as (
			select
				count(vid) as cnt,
				(x[0] / 60) * 60 as cx, (y[0] / 60) * 60 as cy,
				avg((v[1]+v[0])/2) as va
			from st.segments
			where  TS(t[0]) >= TS('2019-01-01') and TS(t[1]) < TS('2019-12-01')
			and ST_Intersects(
					ST_GeomFromText('POLYGON ((11784235 38541265,12039783 38538704,...))'),
					ST_Line(x[0], y[0], x[1], y[1])
				)
			and sl > 0 and v[0] > sl * 1.2
			group by cx, cy
		),
		sp_stats as (
			select avg(cnt) as av, stddev_pop(cnt) as sd
			from speedings
		),
		zscores as (
			select cx, cy, (speedings.cnt - sp_stats.av) / sp_stats.sd as zscore
			from sp_stats, speedings
			where (speedings.cnt - sp_stats.av) / sp_stats.sd > 1.645
		)
		select zscores.zscore, speedings.va, speedings.cx + 30, speedings.cy + 30
		as speeding
		from speedings join zscores on speedings.cx = zscores.cx and speedings.cy = zscores.cy