Why don't drivers respect speed limits on the Rijeka bypass?

Dijana Matošević - 21/04/2021 | 4 min read
Telematics Big Data Traffic analysis Urban mobility

Besides the stunning Kvarner bay scenery, the Rijeka bypass is notorious for frequent changes in posted speed limits. To be precise, there are 21 different speed limit signs on the 8 km segment between Orehovica and Zamet exits.

However, the unreasonably low set speed limits are a common subject of debates for years now. Rijeka bypass was reconstructed and opened for public in 2009 as two-lane grade-separated expressway.

But, somehow, although the Croatian speed limit on highways is 130 km/h, the speed limits on Rijeka bypass are mainly set as low as 70 km/h (Orehovica - Diračje) to 90 km/h between Diračje and Matulji interchanges. These limits are most commonly justified by the mountain terrain and impaired road visibility, but the general public's opinion is that the road is perfectly suitable for driving at 80+ km/h speeds.

Is driving 80+ km/h on the Rijeka bypass hearsay or a fact?

Measuring real-world average travel speed on Rijeka bypass

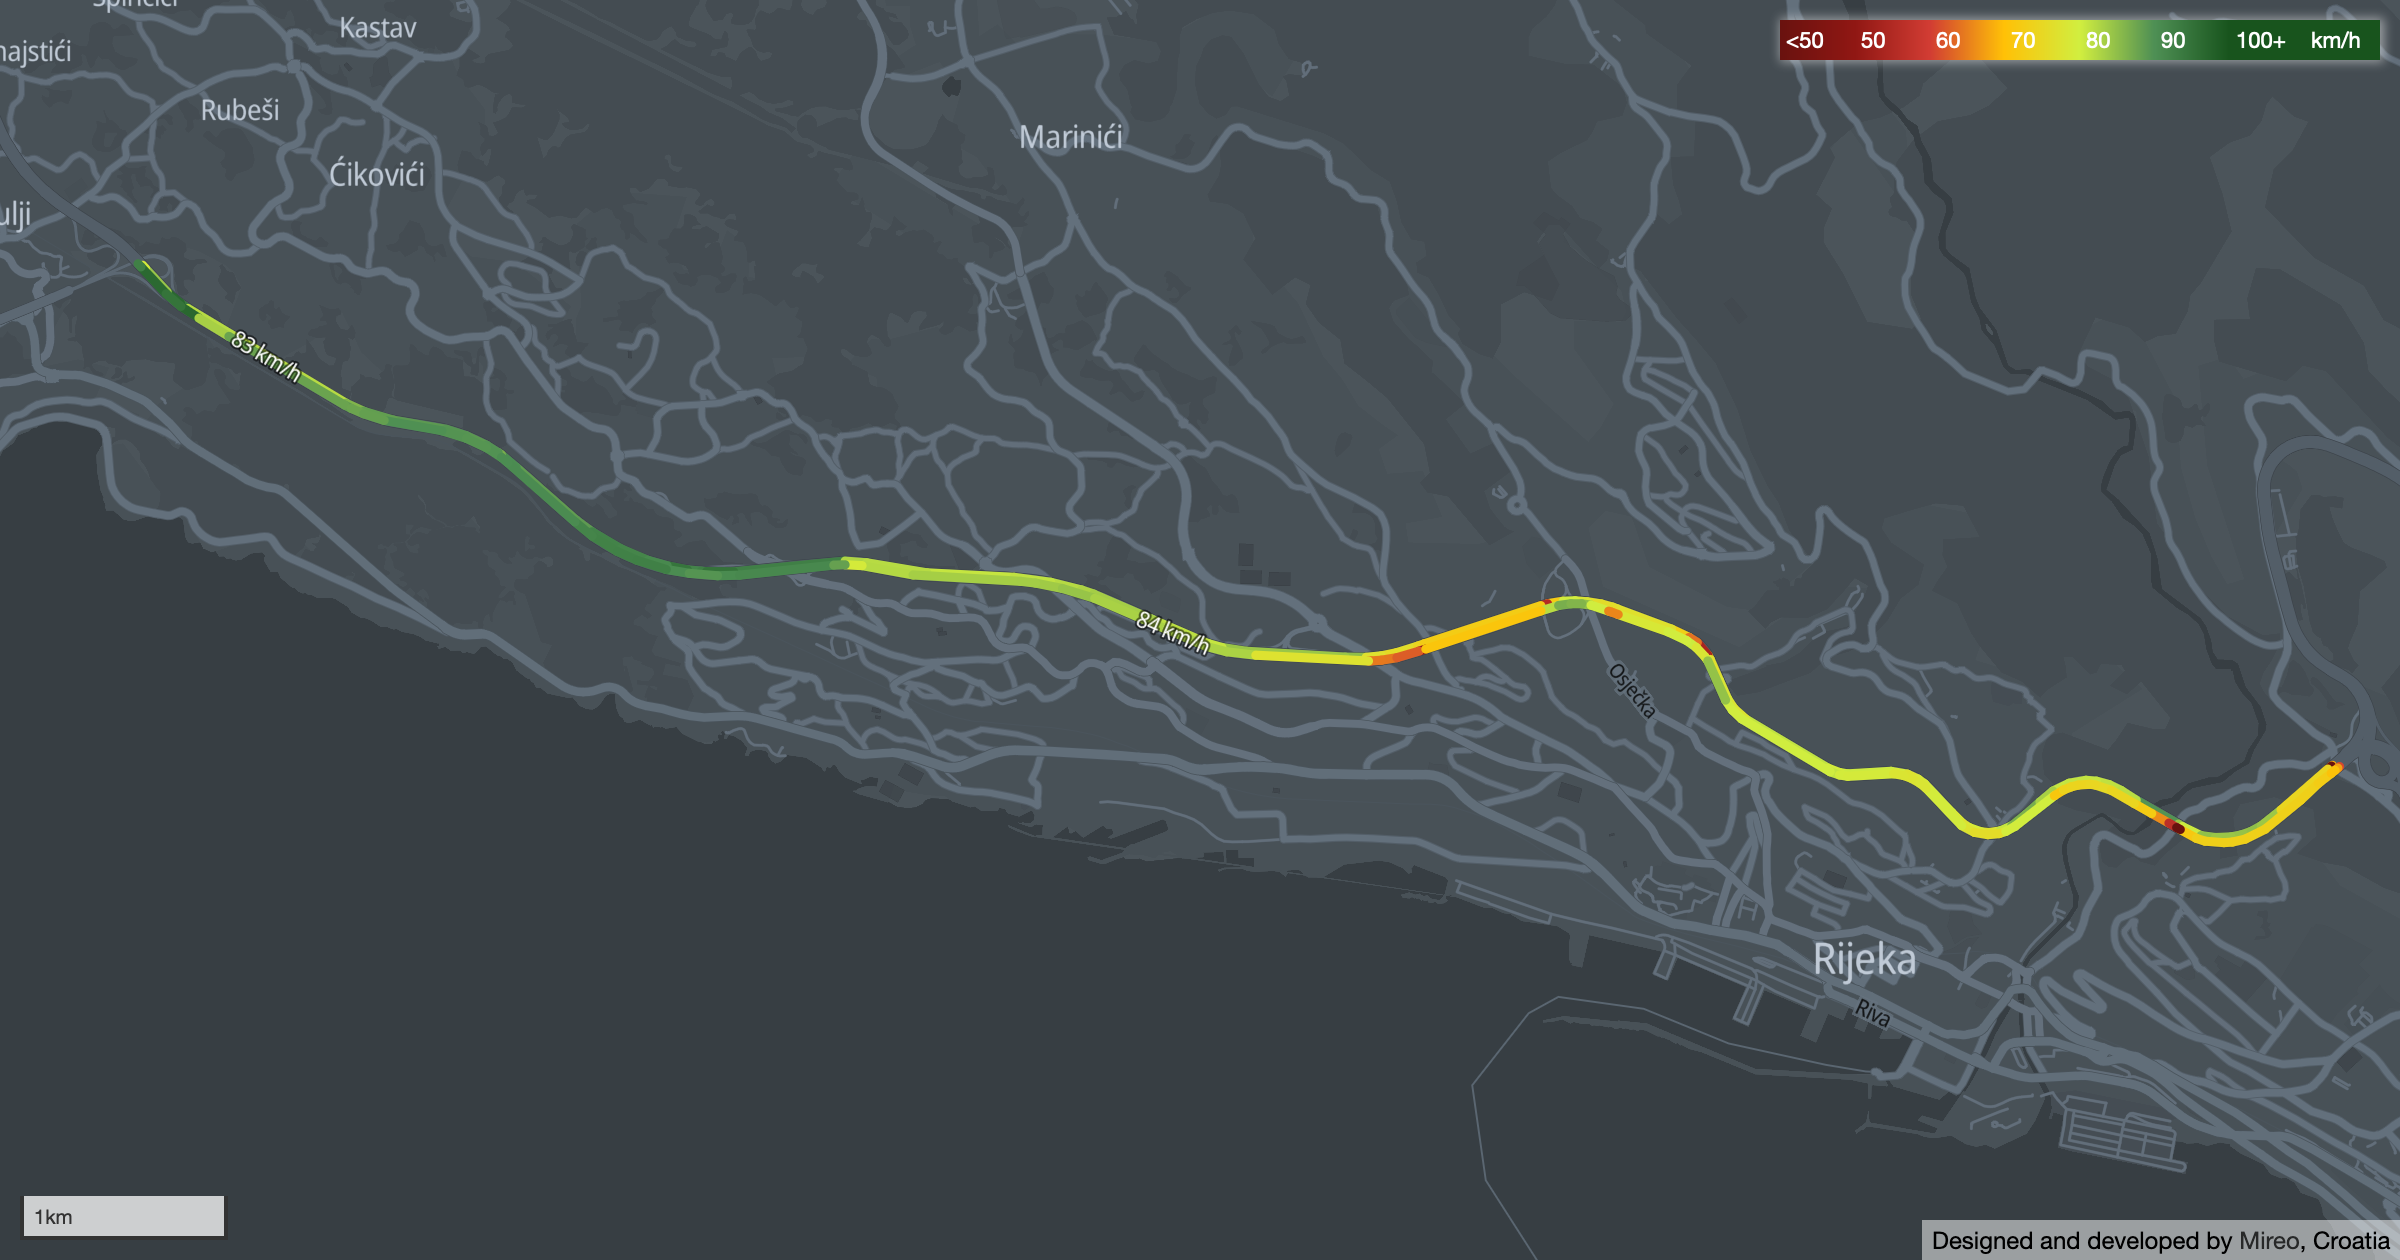
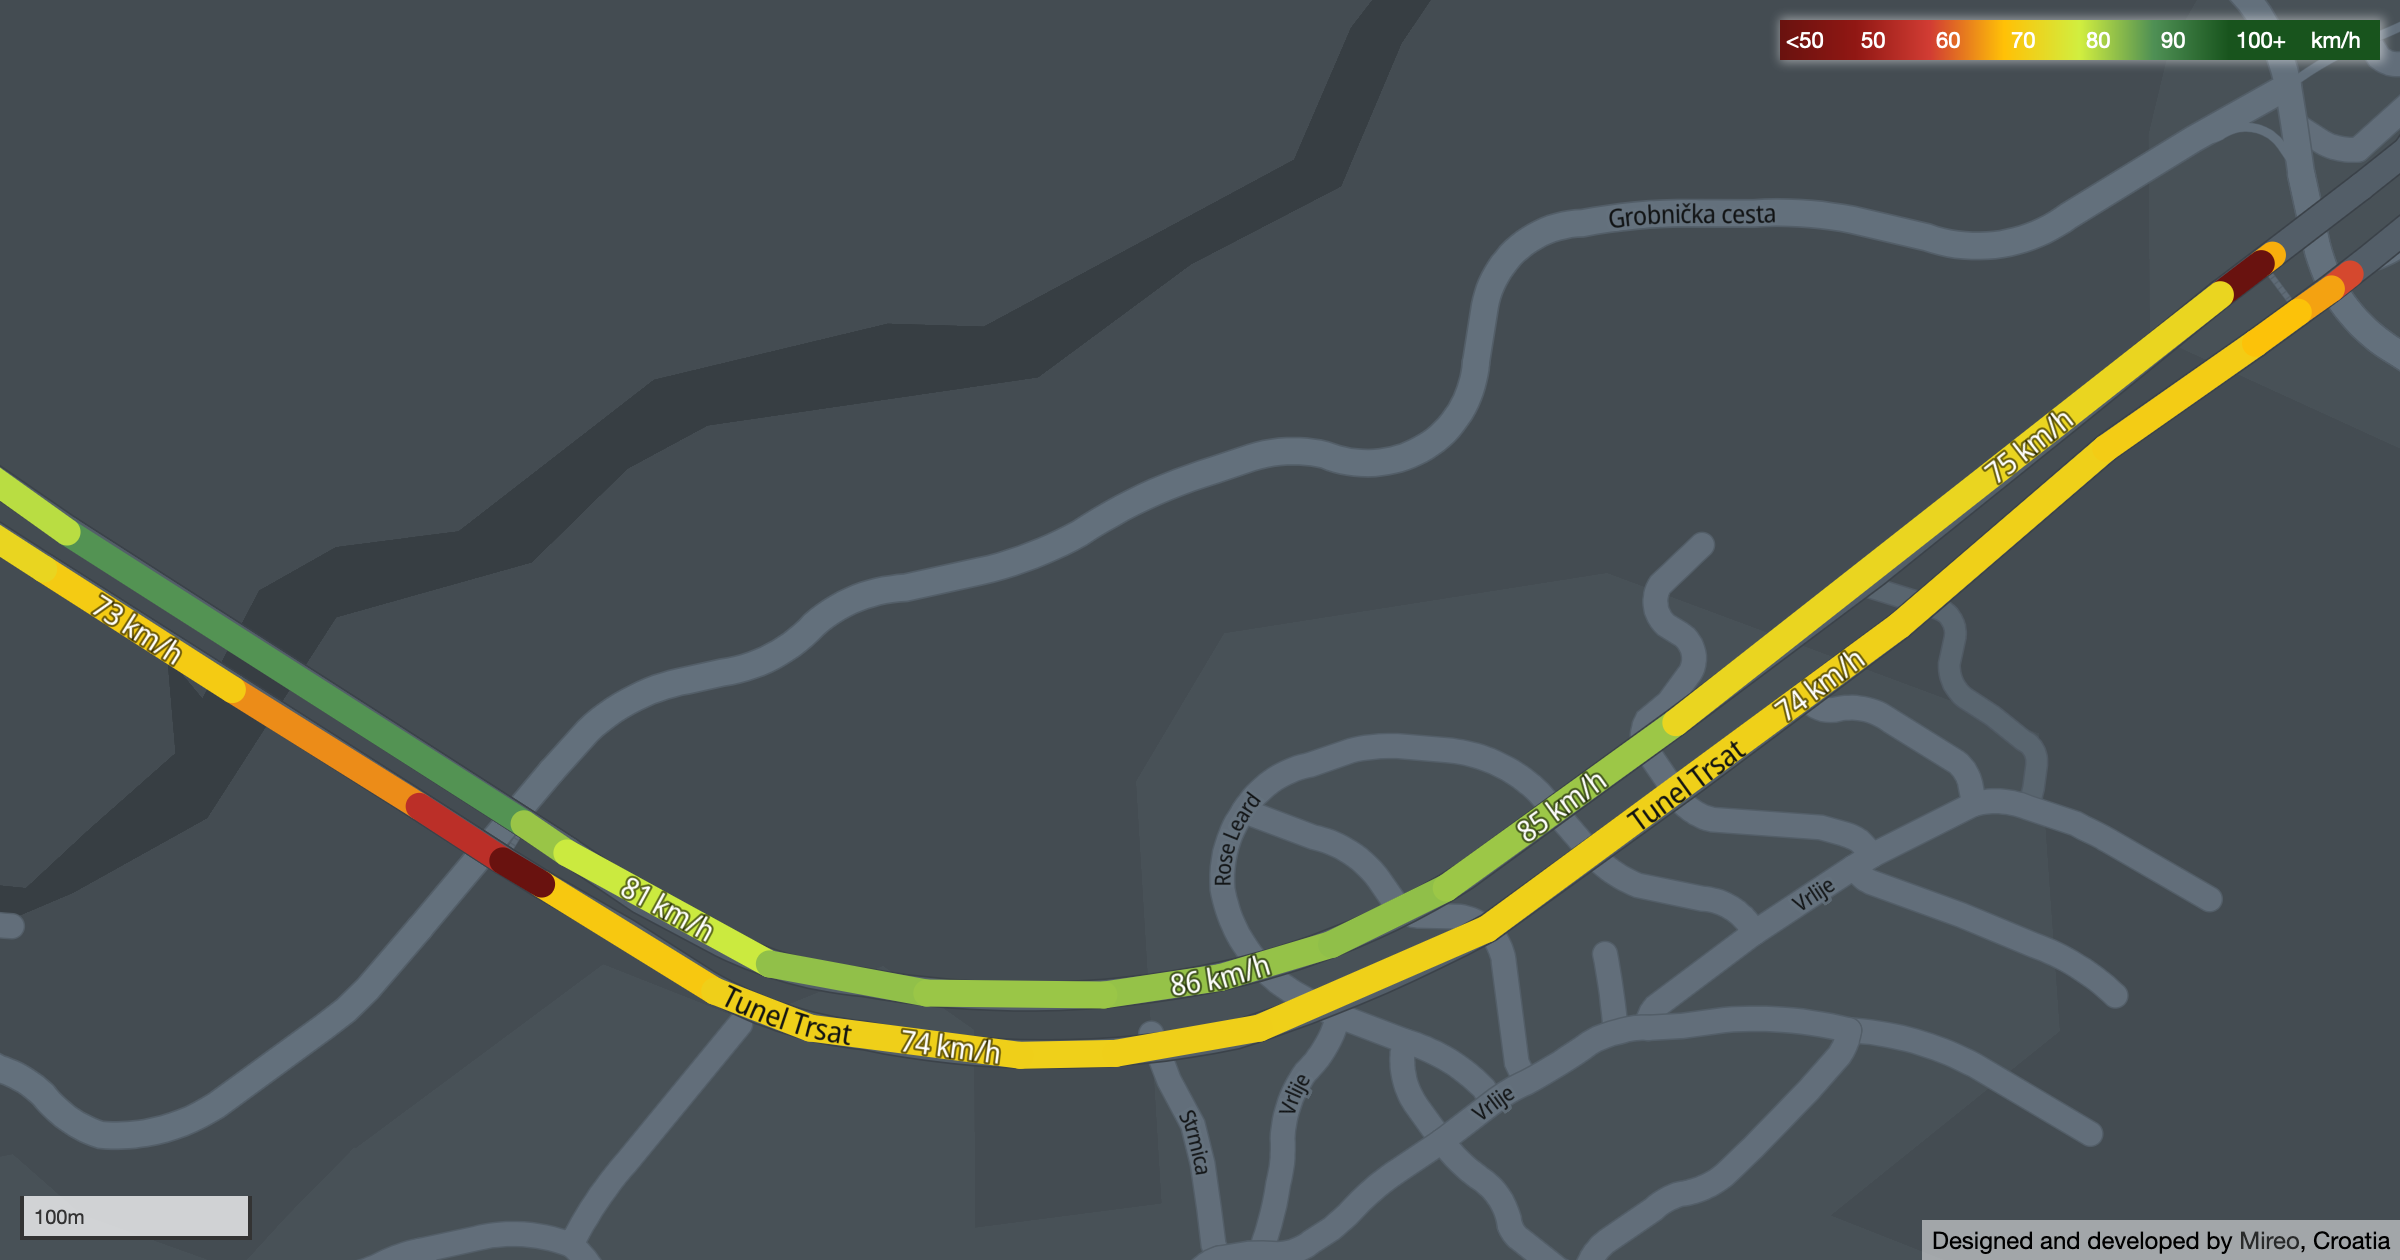
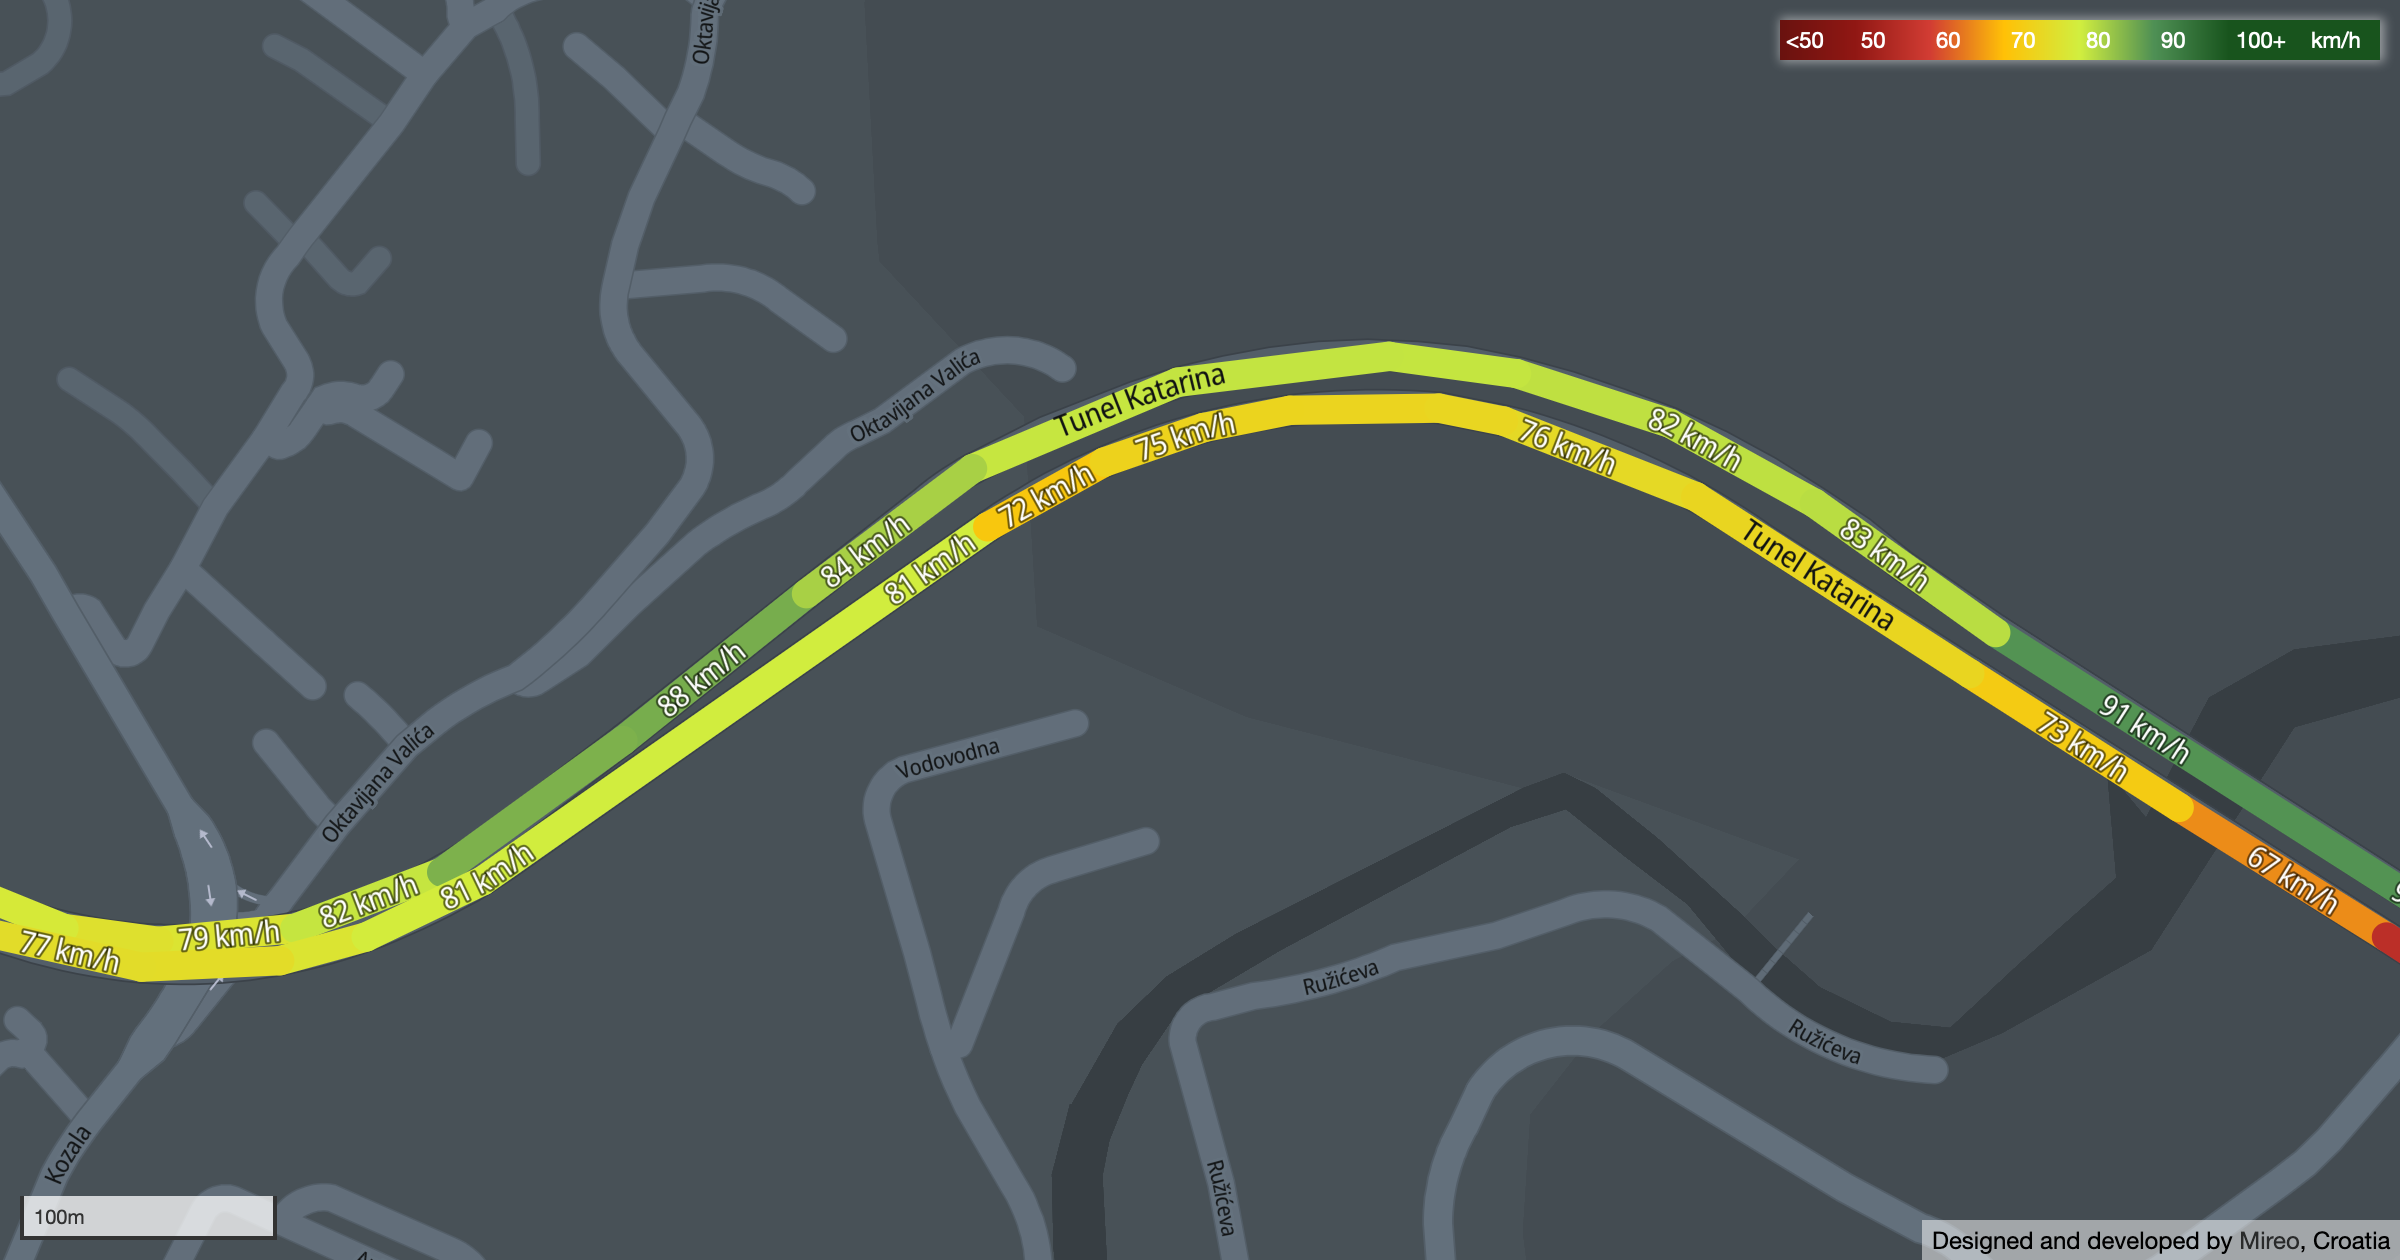
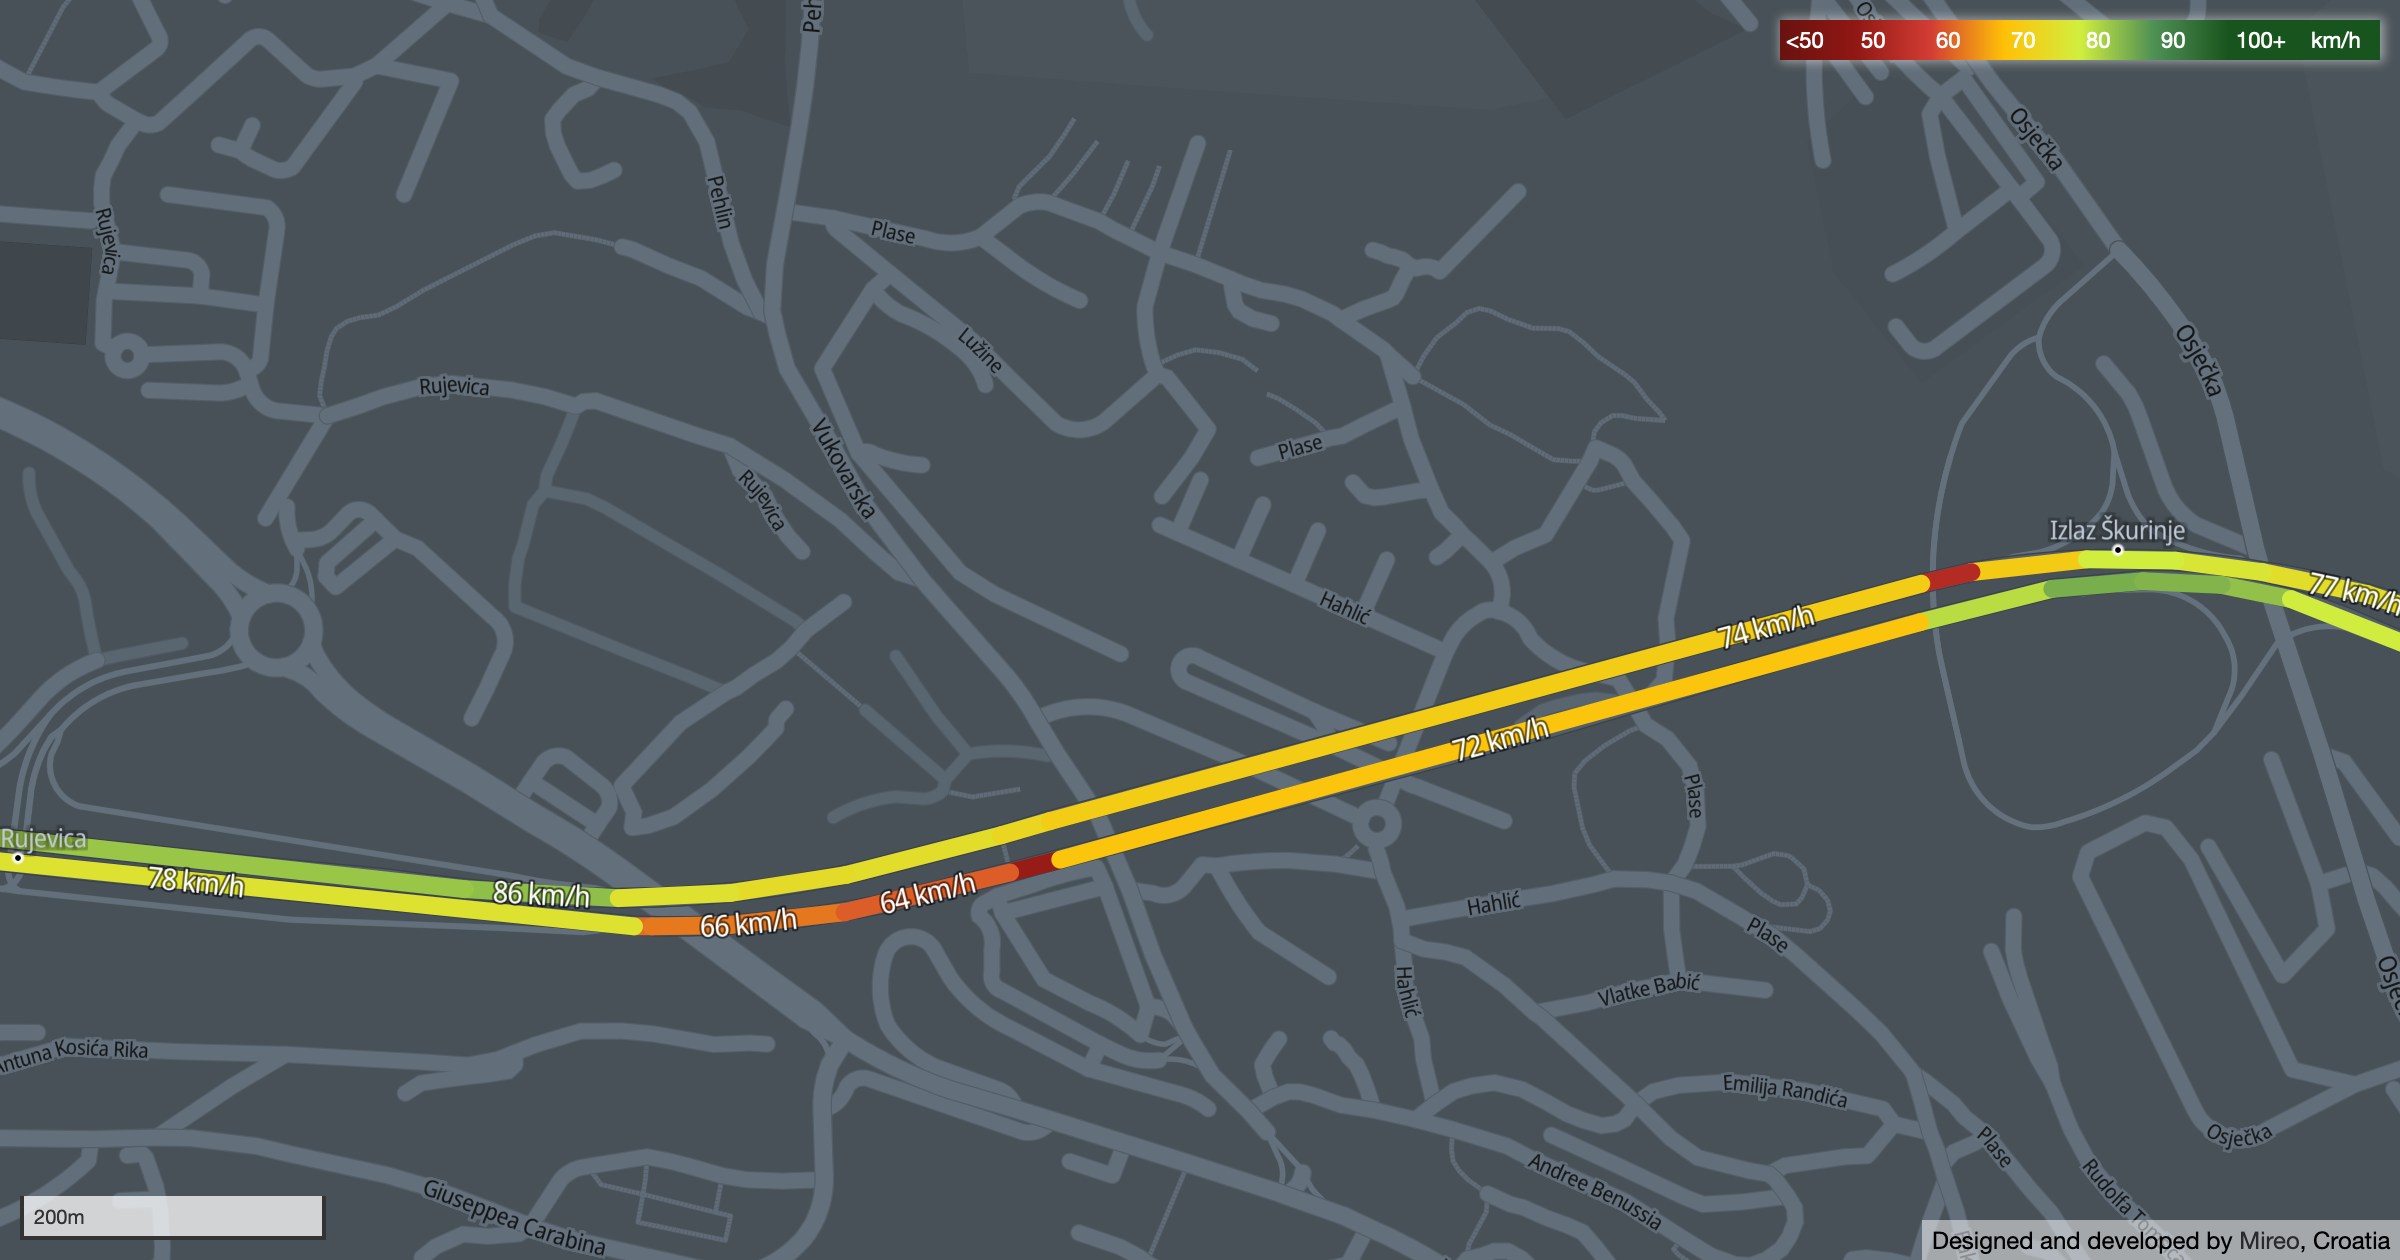
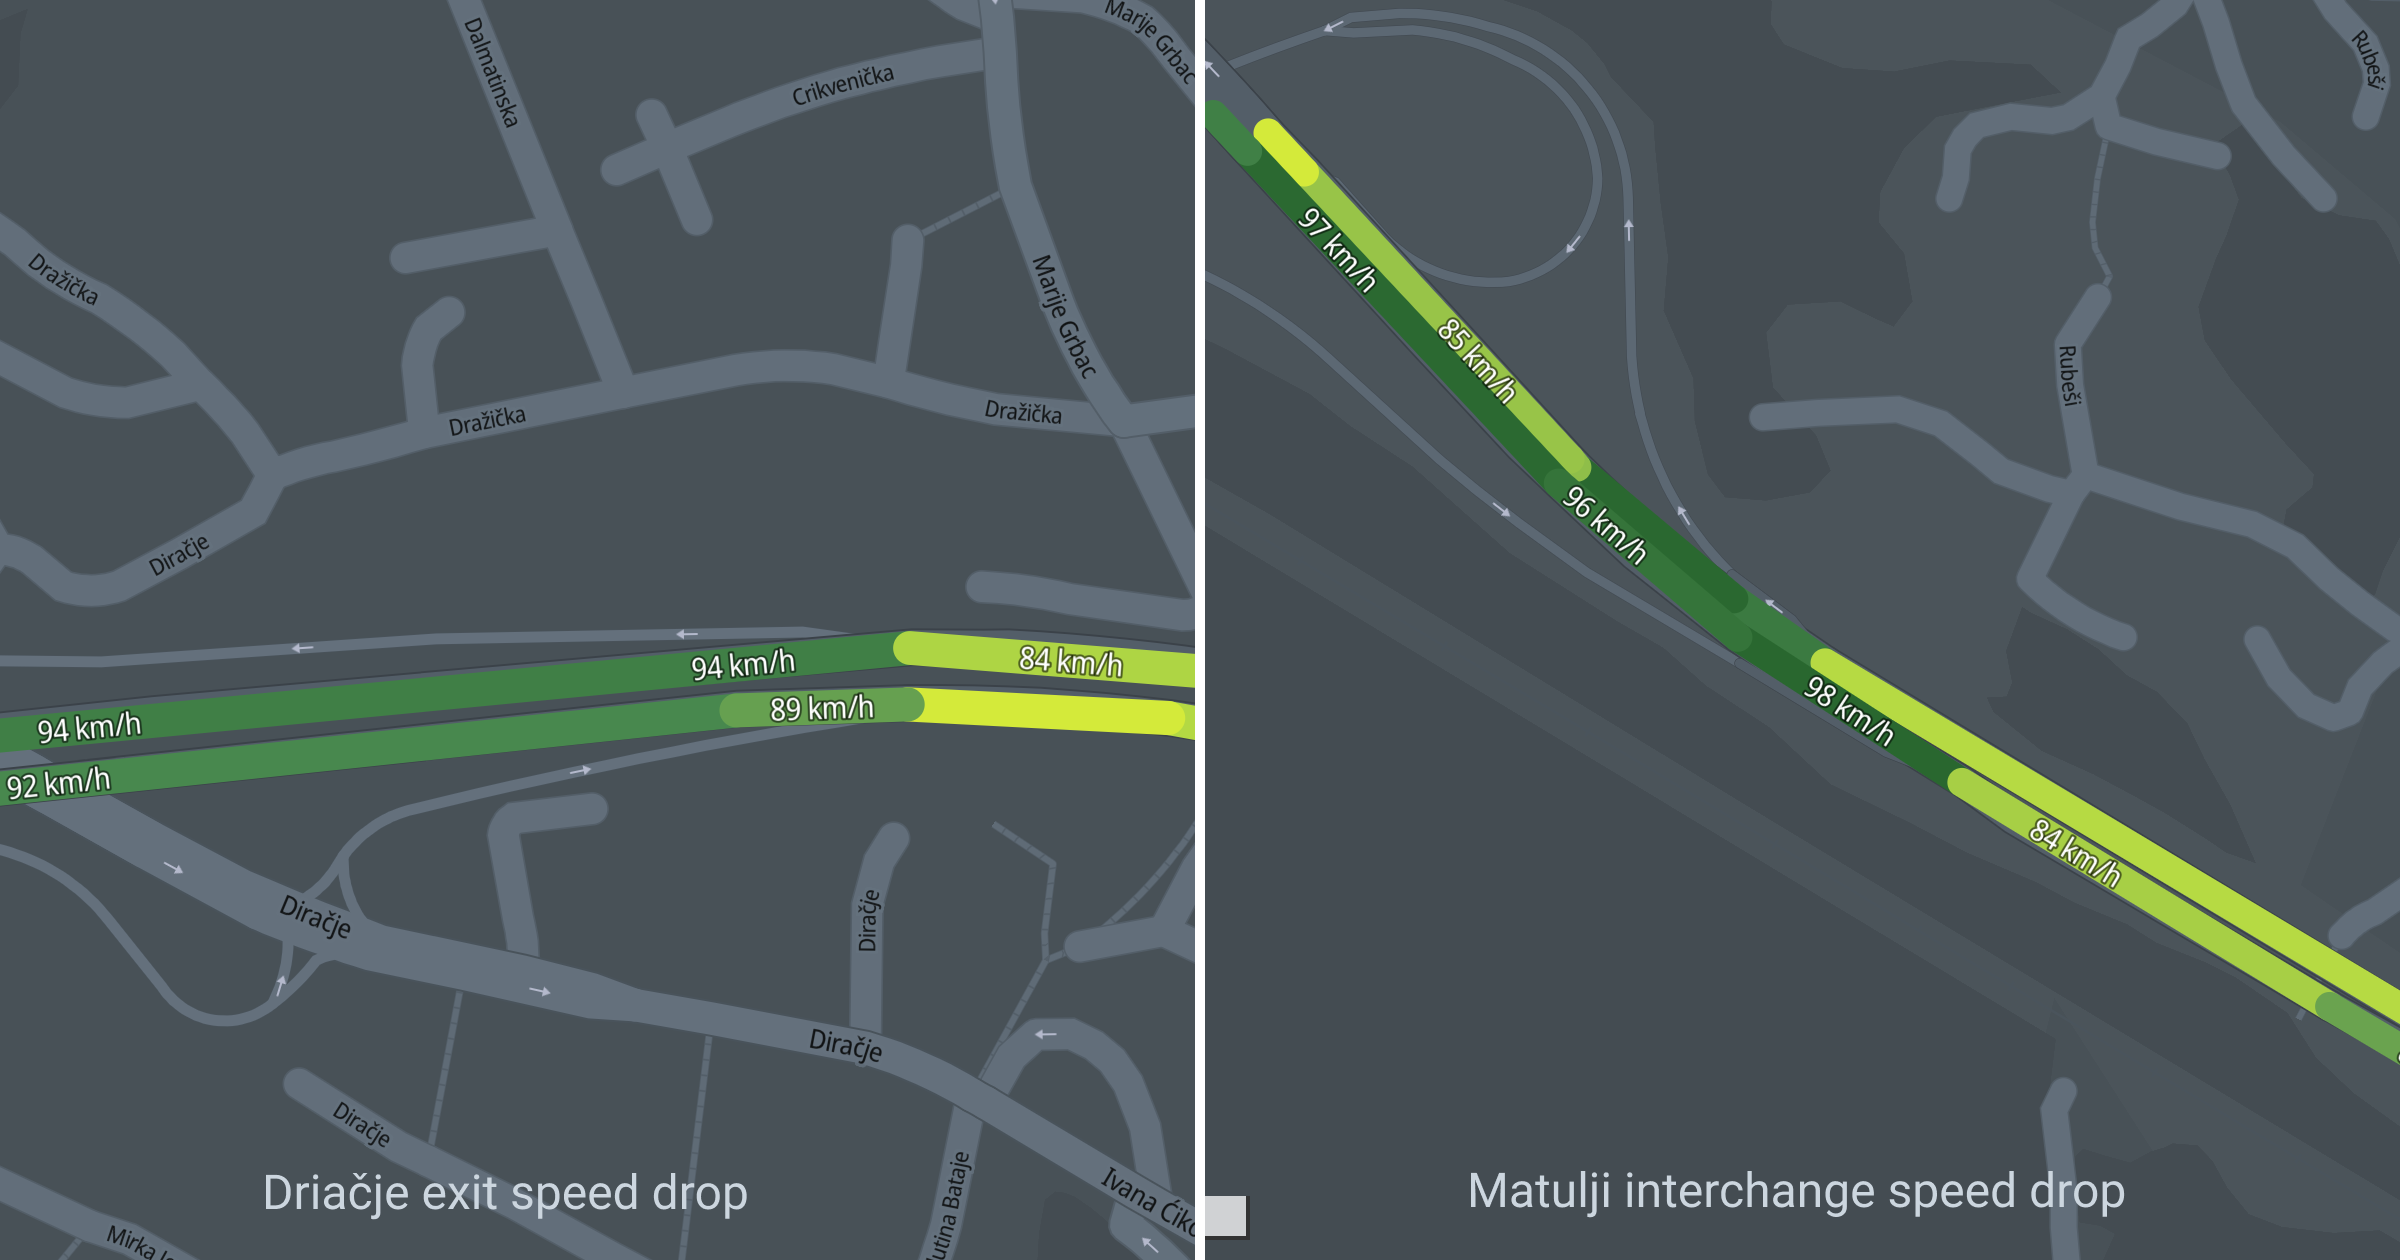
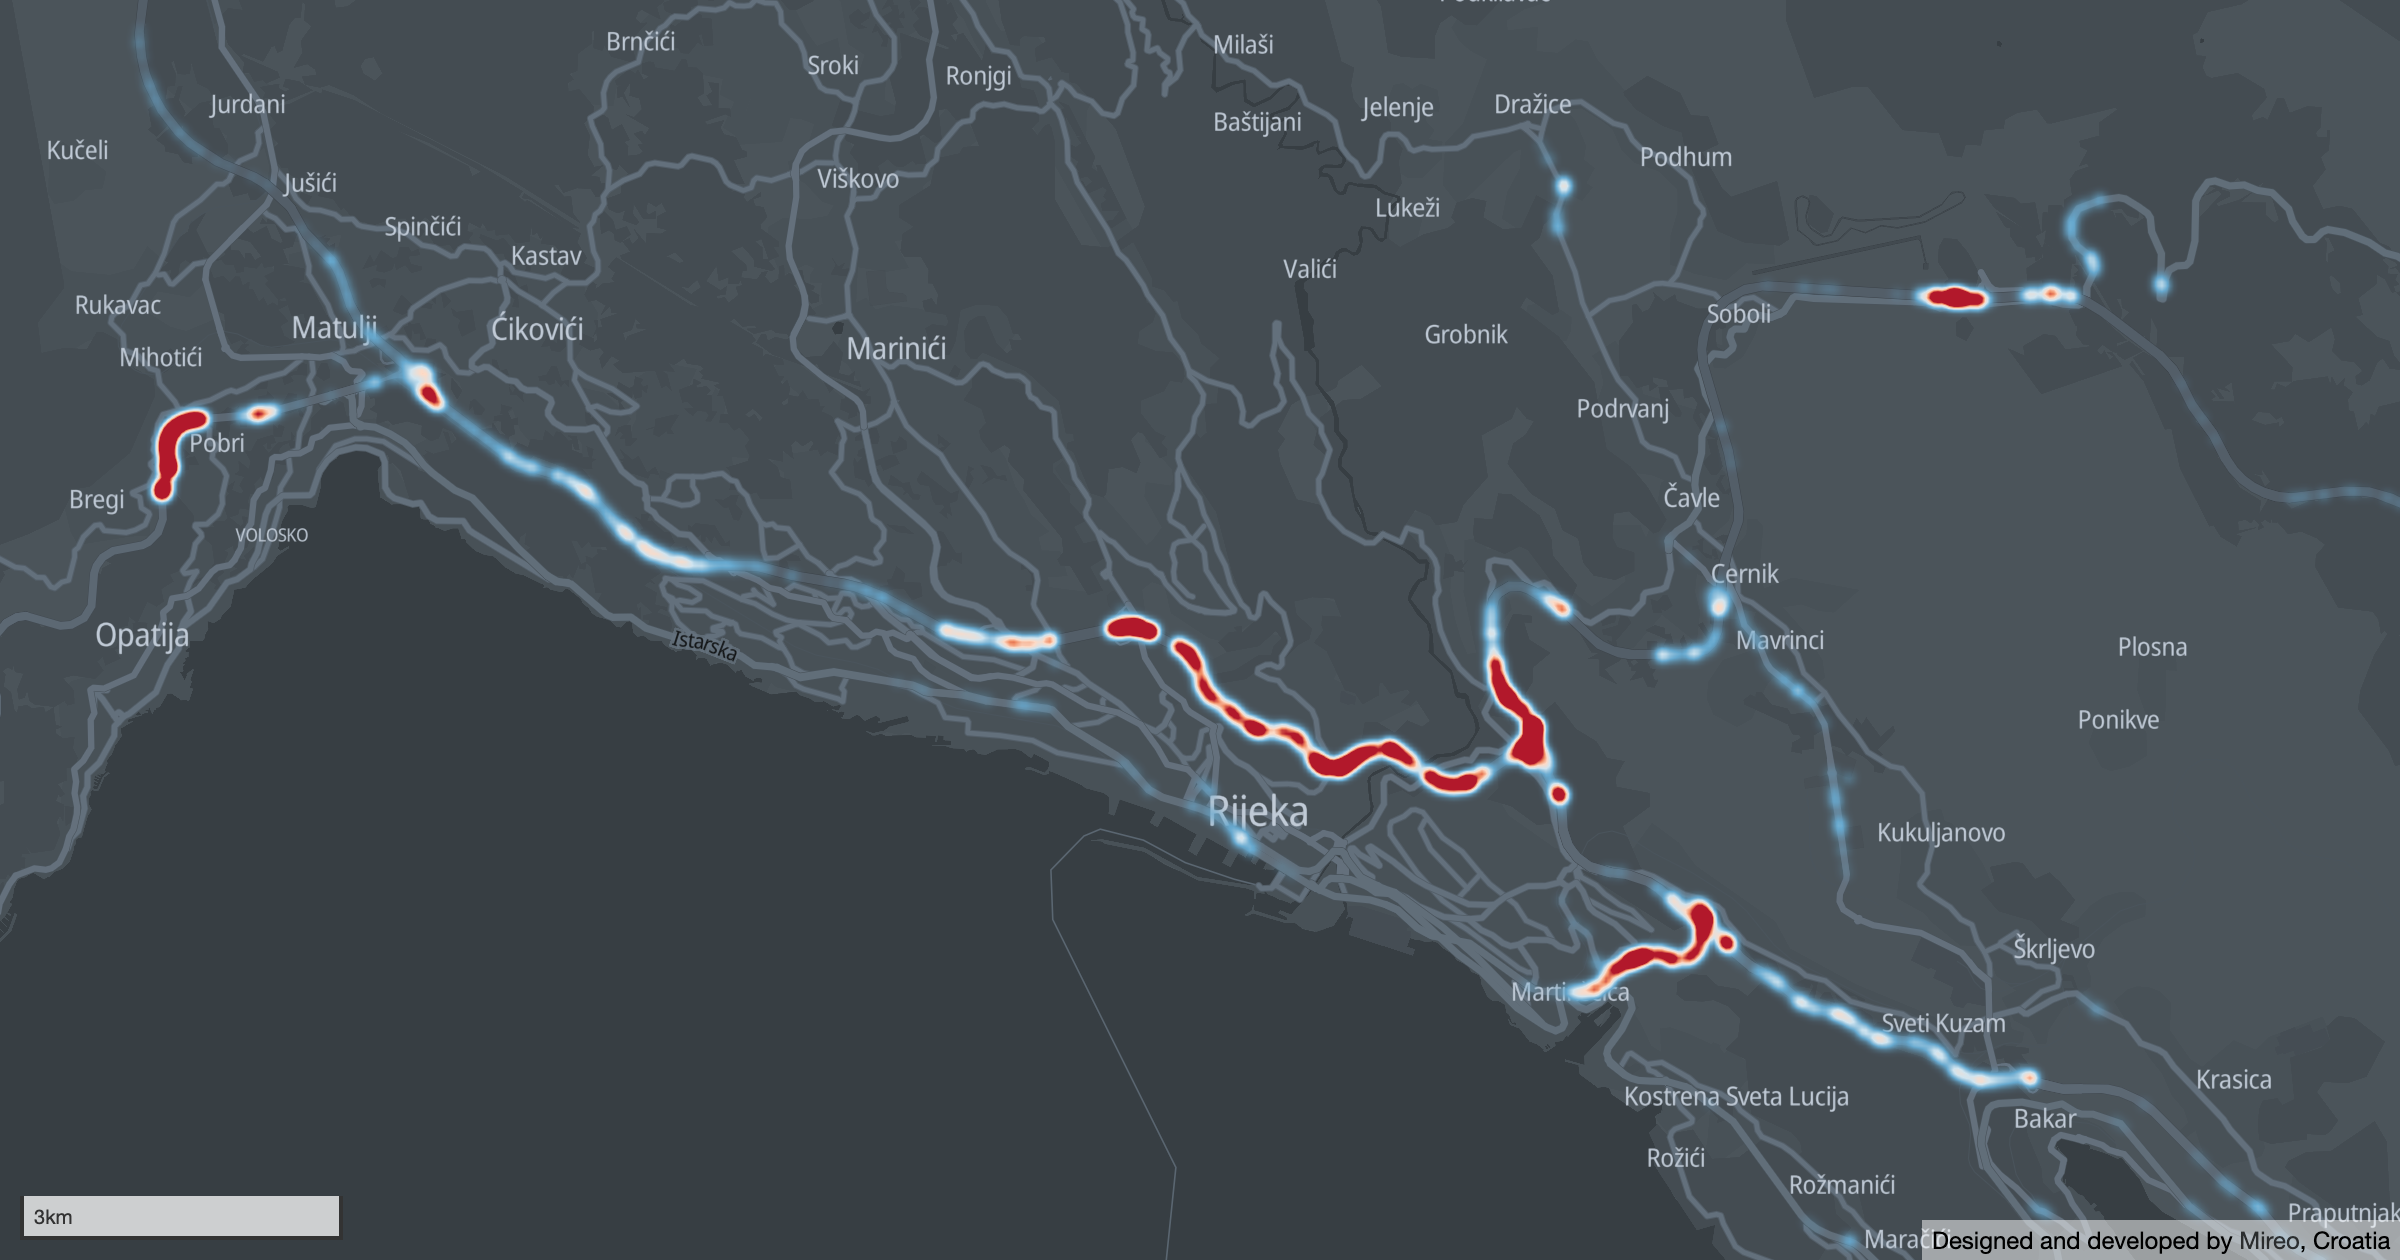
Average travel speed on Rijeka bypass, click on the image to explore the interactive map

For the sake of this argument, we peaked into GPS traces of real-world vehicles from the proprietary GPS tracking solution, and using Mireo SpaceTime Roadway Analytics, we've measured the average speeds across ~100m segments on the Rijeka bypass in both directions.The interactive map of average speed per different Rijeka bypass segments is available here, so feel free to zoom in and explore.

Did we find anything interesting?

Let's start from the beginning.

Average travel speed in Trsat tunnel

Average travel speed in Trsat tunnel

Tunnel Trsat is the first place where we witness quite diverse driving patterns between the east and west direction.

The movement is slower in the southern lane of the Trsat tunnel, and we observe the significant drop in traveling speed just before the tunnel's entry. Why?

Namely, speed police patrols are quite often situated just between the Rječina bridge and the southern entrance to the Trsat tunnel, thus influencing the drivers to lower the speed to 48 - 58 km/h. However, they tend to increase the speed immediately after passing a police patrol. Drivers from the opposite direction are not affected and drive significantly faster after exiting the tunnel - between 80-90 km/h.

The speed limit in the southern lane is only 50 km/h, but the average speed is ~75 km/h, and the speed limit in the northern lane is 70 km/h with an average traveling speed varying between 75 - 85 km/h.

Average travel speed in Katarina tunnel

Average travel speed in Katarina tunnel

The speed limit in the Katarina tunnel is 60 km/h, but the average speed is between 75 - 85 km/h.

Average travel speed in Skurinje II tunnel

Average travel speed in Skurinje II tunnel

A fixed speed camera is placed just before the entrance to the southern lane of Škurinje II tunnel. Therefore, the traveling speed significantly drops to 52 - 65 km/h and, quite understandingly, abruptly increases to 71 km/h just after the camera.

Average travel speed Matulji interchange and Diracje exit

Average travel speed Matulji interchange and Diracje exit

Near the Diračje exit and Matulji interchange, we observe the effects of incoming and exiting vehicles. Cars changing traveling direction need to lower their speed, which inevitably affects nearby vehicles. Therefore we observe a 5 - 10 km/h drop in traveling speed nearby highway ramps.

Despite the fixed speed camera located just before the Diračje Rijeka West exit (direction east), a significant drop in traveling speed isn't observed. Most probably, drivers find the 90 km/h speed limit to be somewhat reasonably set, and the speed camera doesn't affect their traveling.

The average speed doesn't tell you enough? Take a look at the speed distribution.

Even though 70 km/h is the most common speed limit, on one-half of the A7 segment between Orehovica and Matulje interchanges, drivers drive at speeds between 70 and 90 km/h.

Ironically, drivers equally often drive below 70 km/h and above 100 km/h- approximately every sixth kilometer.

Rijeka bypass travel speed distribution

Rijeka bypass travel speed distribution

Where else do drivers like to step on the gas?

Speeding hotspots on Rijeka bypass

Speeding on Rijeka bypass

Using Mireo SpaceTime Roadway Analytics, we've analyzed severe speeding hotspots in the city of Rijeka. A similar analysis of Zagreb city is available here.

We define severe speeding as speeding more than 30 km/h above the posted speed limit.

For a reference, the minimum penalty for speeding 30 - 50 km/h over posted speed limits in built up areas is 400 € or 260 € outside built up areas. Those driving more than 50 km/h above posted speed limits in built up areas can expect up to 60 days imprisonment and a 2,600 € fine.

1. Besides the infamous Rijeka bypass, the almost 2 km long and perfectly straight segment near the Grobnik Circuit is quite popular to hit the gas pedal. Grobnik Circut is a popular place for motorcycle training and races, so it doesn't surprise that some drivers feel inspired to push the pedal when passing by. Apparently, some wish they could be racing, while others are actually racing.

2. The A7 segment between Draga interchange and Rijeka entrance is a 2-lane road, mainly grade-separated, but with the speed limit set to 60 km/h.

3. The 2-lane and grade-separated road A7 segment towards Bakar, despite the 100 km/h limit, is also a popular place to drive over the speed limit, presumably because it's a quite straight segment.

4. A8 segment passing through Mihotići village is a rather winding 1-lane road with a 50 km/h speed limit, but still a very popular place to speed.

How we did it?

We took historical GPS driving data from vehicles of mixed types from the proprietary GPS tracking solution, matched them precisely to the road network, precisely reconstructed their speeds, and fused the reconstructed trajectories with the underlying map data, e.g., posted speed limits. In both cases, we included trips driven in March and April 2021.

To determine the speeding hotspots, we divided the wider city area into 40x40 m squares and counted the number of occurred speeding events in each square and thus identified the squares with the highest number of speeding events.

To determine the average traveling speeds, both traveling directions were split into smaller ~100m segments.

Want to see more?

If you're intrigued to explore similar analyses of driving patterns, we suggest you explore the 200.000 vehicles interactive Mireo SpaceTime demo.

Mireo SpaceTime is a set of technologies curated to facilitate vehicle data monetization and significantly improve the existing ones.

SpaceTime Interactive Demo

If you liked this, here’s what to read next: