COVID-19’s paradoxical impact on road safety

Dijana Matošević - 24/08/2021 | 5 min read
Telematics Big Data Traffic analysis Urban mobility COVID-19

The USA vs. EU

Car crash COVID-19

The fatalities disproportional to the decrease in traffic

As per the International Transport Forum 2020 Road Safety Annual Report, in the 62 member and observer countries, road fatalities plummeted during the first months of 2020.

Strict containment measures and stay-at-home orders decreased the overall mobility, including the number of circulating vehicles.

Although the 2020 report included just the preliminary 2020 data, the main conclusion is that the decrease in traffic-related fatalities has not reduced in proportion to the reduction of traffic mobility.

However, the COVID-19’s impact on road safety is entirely different between the European countries the USA. To explain this phenomenon, we've gathered the latest research findings and discuss the various telematics-based solutions for increasing road safety to explain this phenomenon.

The USA paradox

Deaths up 8% even as mileage drops 13%

The National Safety Council (NSC) released the 2020 traffic statistics showing that 8% more people died in crashes on the U.S. roads in 2020 than in 2019 - 42,000 vs. 39,000. However, estimated vehicle miles traveled show a 13% decrease compared to 2019 (3.2 bn vs. 2.8 bn miles).

A slightly lower increase in fatalities reports the National Highway Traffic Safety Administration (NHTSA) - 4.6% more fatalities in crashes January-September 2020. (The NHTSA uses a 30-day cutoff period to measure traffic deaths, unlike the NSC measures deaths up to a year after a crash.)

What could explain such discrepancy?

The NSC report cites few possible reasons for such disproportion between fatalities and traffic intensity, such as increased speeding due to lower traffic volume, increased truck traffic, the rise of cyclist circulating, and less enforcement of traffic rules as the authorities’ focus shifted towards pandemic-related priorities.

To address the increase in traffic fatalities during the outbreak, the NHTSA followed with a series of special traffic safety reports, and some of the results were, to say the least unanticipated.

Alcohol and drugs in traffic

Driving under the influence COVID-19

Entirely independent of the COVID-19 public health emergency, the NHTSA commenced the Alcohol and drug prevalence study in seriously and fatally injured road users in September 2019, which fortunately continued during the coronavirus outbreak.

The results indicate a remarkable surge in drug prevalence during the lockdown, compared to the period before the outbreak - 64% vs. 50% of roadway users tested positive for at least one drug category, 25% vs. 17% positive for two or more drugs, 21% vs. 27% for alcohol, and 7% vs. 13% positive for opioids.

The NHTSA’s series of 2021 traffic safety reports bring evidence that the remaining drivers on roads engaged in riskier behavior, such as increased speeding, not using seatbelts, and driving under the influence (DUI).

Europe

Record low traffic deaths in 2020 in Europe

Opposite to the USA, road deaths in Europe fell by 17% in 2020, compared to 2019, show the preliminary findings presented at European Commission Road Safety Results Conference. That’s 18,000 road deaths in 2020, or 4,000 less than in 2019.

For reference, with 4,2 road traffic deaths per 100,000 population, European roads are by far the safest in the world (the global death rate is 18 per 100,000), while the most dangerous roads are in Africa and South-East Asia.

The most substantial decline in road fatalities occurred in the worst-hit countries - Italy, France, Hungary, Belgium, Denmark - above 20% compared to 2019. However, Estonia, Ireland, Latvia, Luxembourg, and Finland recorded an increase in fatalities, presumably due to fluctuating nature observed in smaller countries.

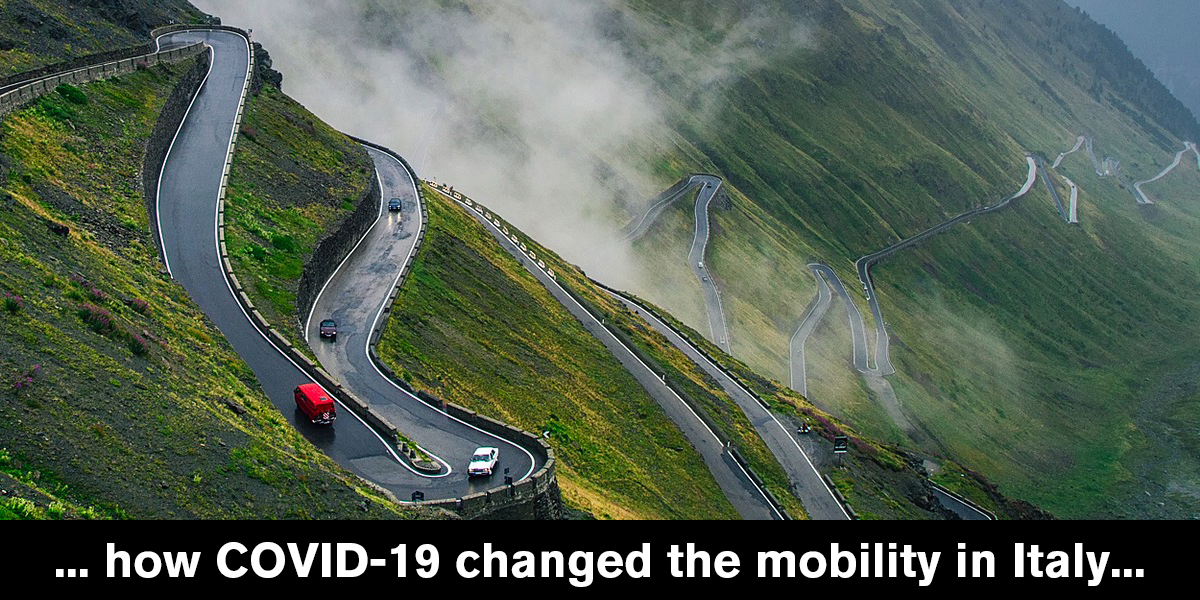
Let's observe Italy as one of the countries hit hardest by COVID-19:

Italy - casualties down by 29%, mileage by 23% in 2020

Italian National Institute of Statistics (ISTAT) preliminary data show a 29% reduction in traffic-related deaths or injuries from January to September 2020.

Focusing strictly on the lockdown period, the number of traffic accidents in Italy (including those with only vehicle damage) was down by 50% in March and 80% in April. Traffic in April plummeted by 80%.

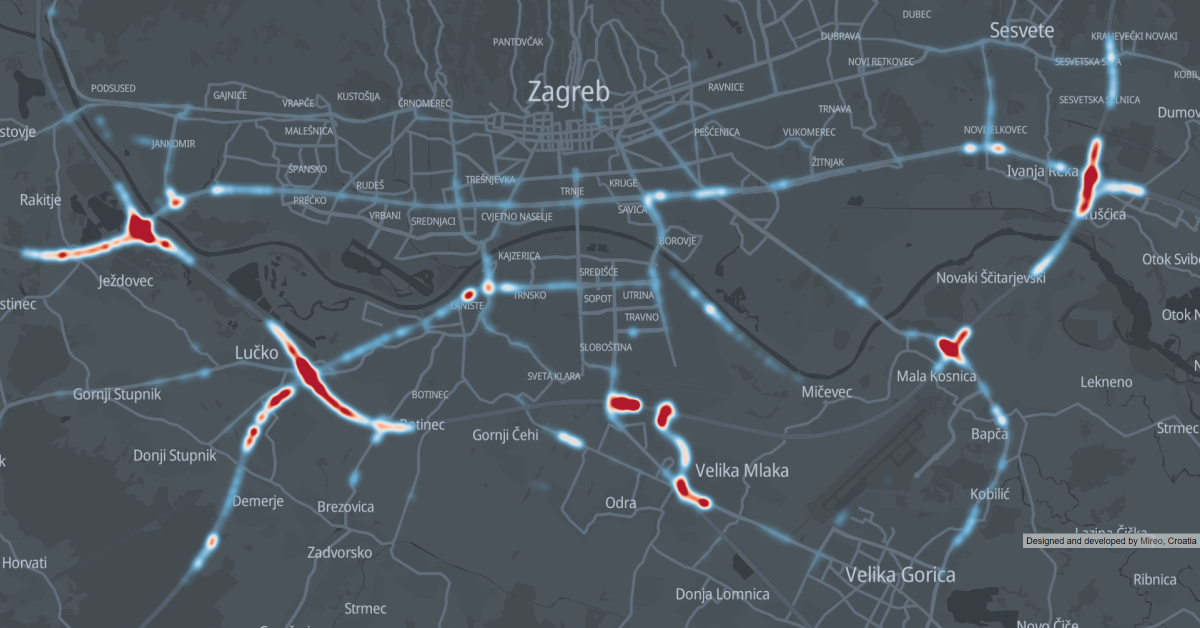
Using SpaceTime Roadway Analytics as a tool, we've analyzed the changes in vehicles' travel patterns before and during the lockdown in Italy. We analyzed the anonymized raw GPS data collected from the onboard installed GPS devices from 500,000+ private Italian cars during the first three months of 2019 and 2020.

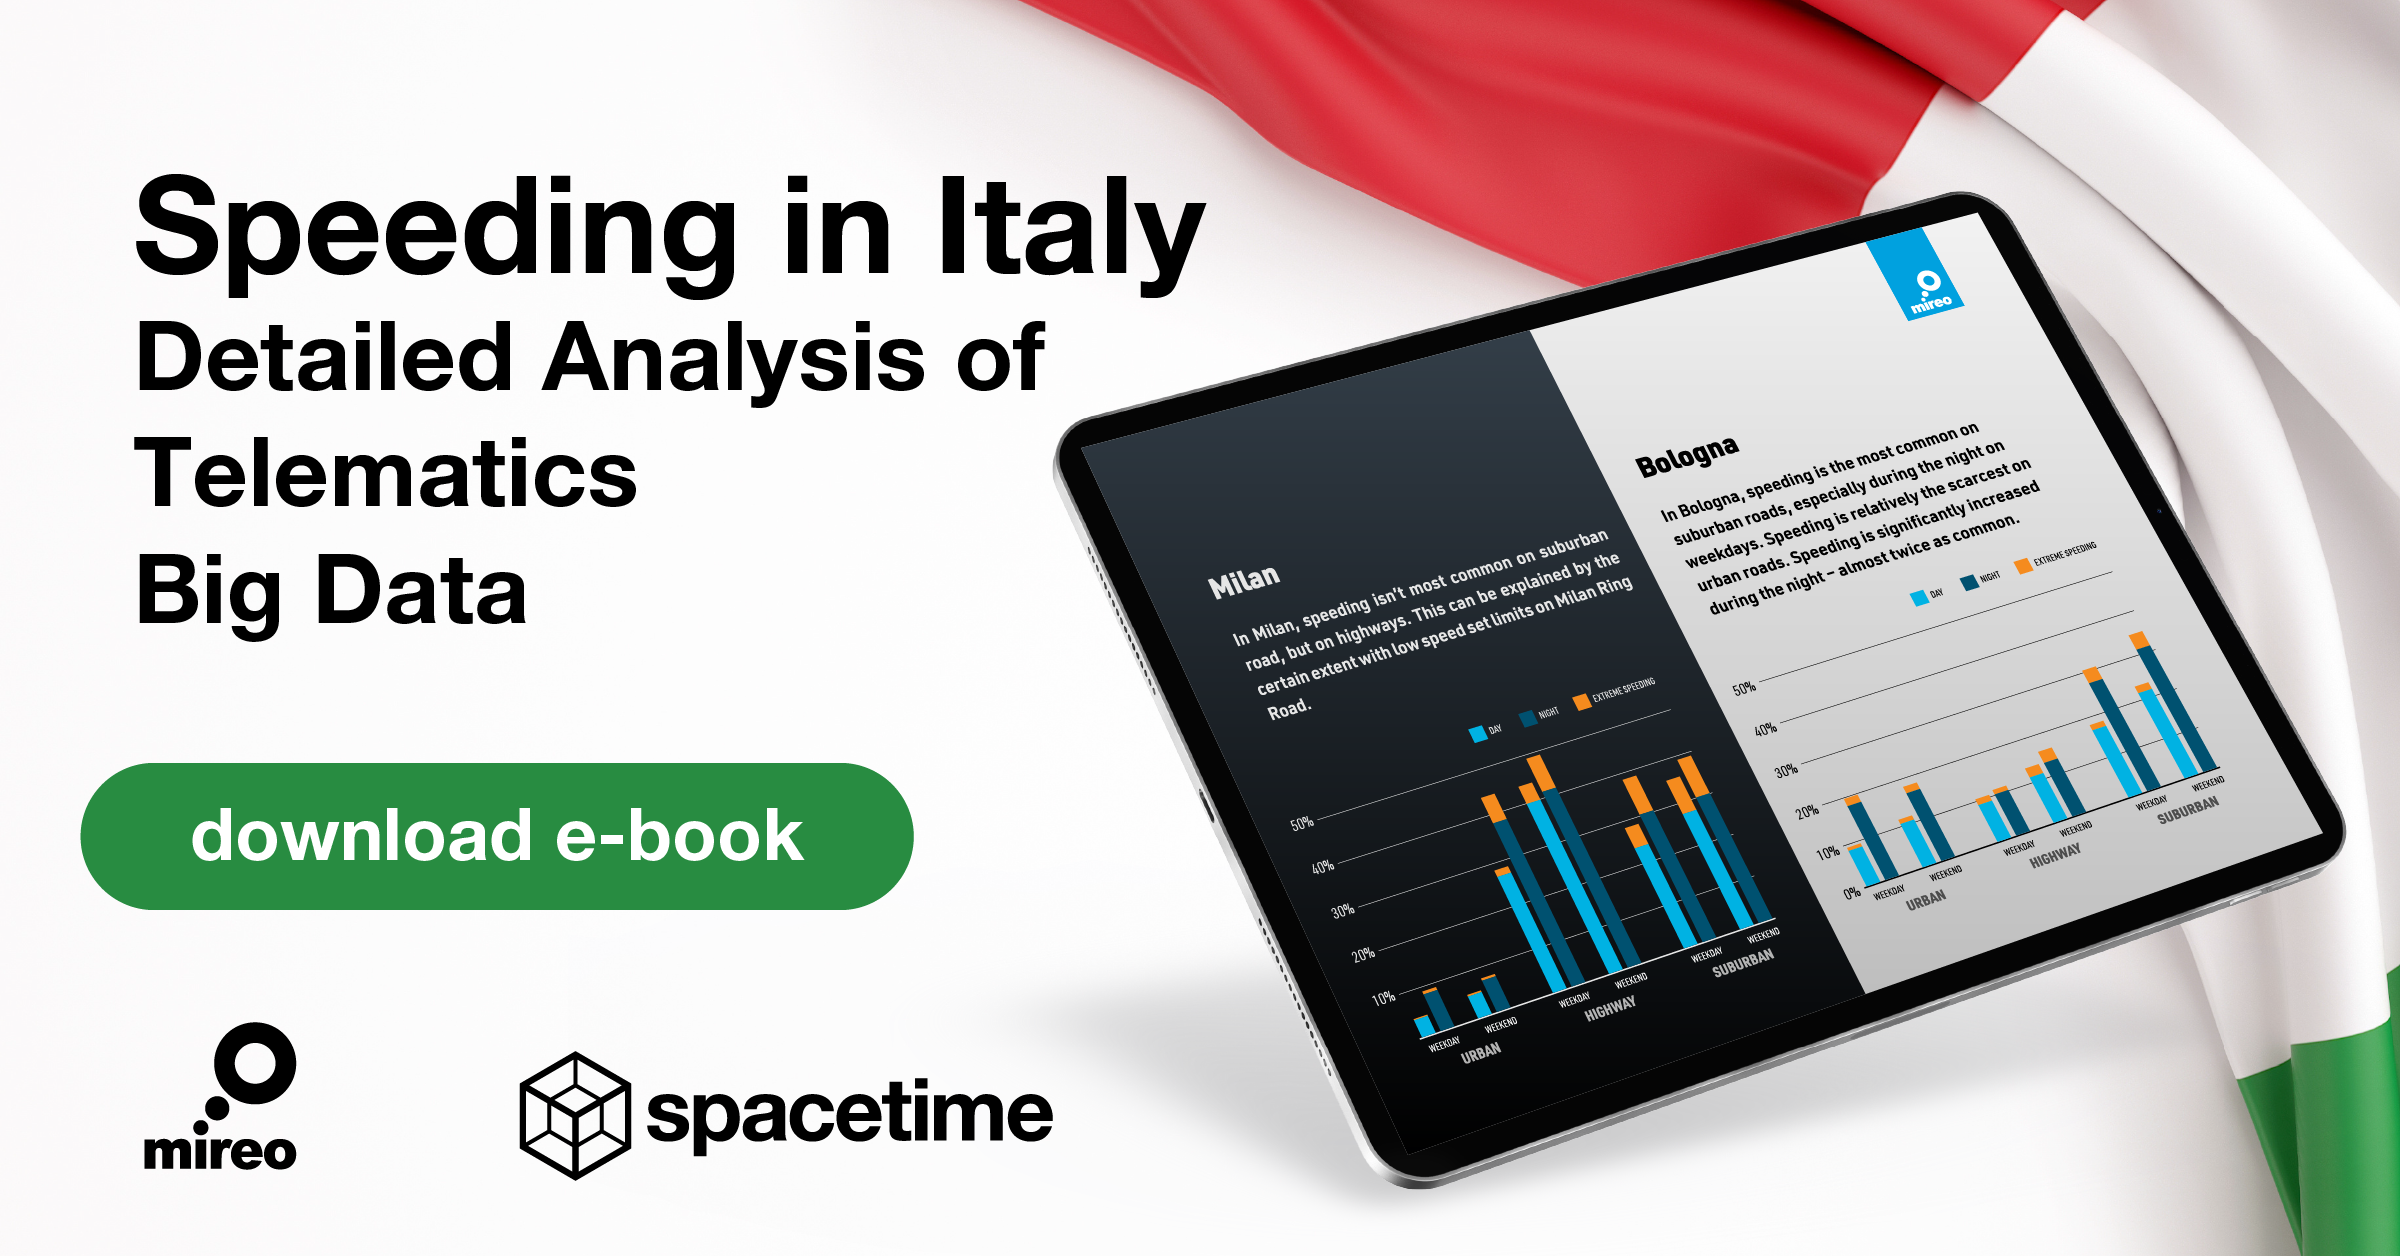
This comprehensive analysis of the effect of COVID-19 on mobility in Italy is available in the eBook format downloadable here:

Italian speeding patterns - the frequency and the severity of speeding throughout 9 biggest cities

Our analysis showed a 3.5 fold decrease in average daily mileage traveled during the lockdown (36km vs. 10km daily mileage). The percentage of everyday circulating vehicles plummeted from 80% to well below 50%.

The lower traffic volume had a tremendous impact on the traffic. For example, during the morning rush hours in Milan, drivers would typically spend 74% of their time driving below 30 km/h, compared to 59% of the time during the lockdown.

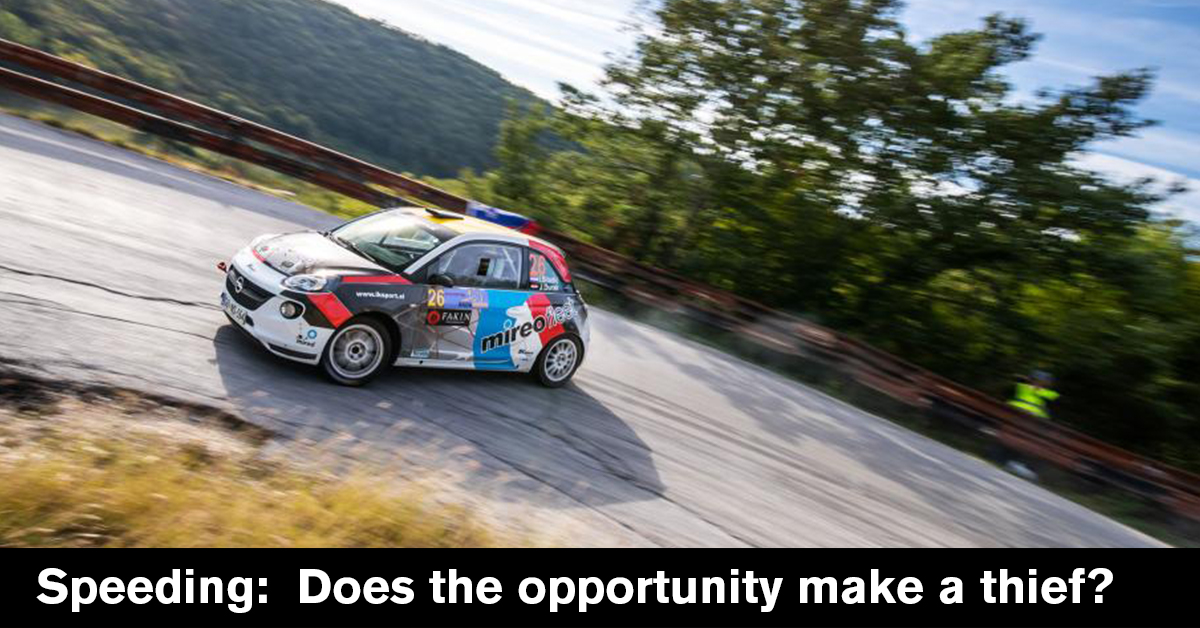
The analysis showed a striking speeding increase during the lockdown. Typically, out of the average yearly traveled 10,000 km, drivers would travel 1,500 km in speeding. But during the lockdown, the percentage of speeding mileage rose to 26 %, translating into 2,600 km yearly, or 1,000 km more than usual!

Despite the surge in speeding during the lowest ever traffic in Italy, the traffic accidents plummeted!

Increasing safety - Zero road fatalities by 2050

Speeding road safety

The EU Road Safety Results Conference also expresses the concern in the disproportion of lower traffic volume and decrease in road fatalities. Similar to The USA, some EU countries also report riskier driving behavior, particularly speeding.

Back in 2018, the European Commission confirmed its long-term goal of moving towards zero road fatalities by 2050 and proposed new interim targets and key safety performance indicators, such as vehicle safety, seat belt wearing rate, speed compliance, and post-crash care.

Likewise, the Road to the USA’s Zero Coalition and NSC released a comprehensive report and a list of strategies for eliminating road fatalities. The strategies include a series of immediate life-saving measures that should consist of equitable implementation of road safety laws, policies, and infrastructure improvements, mandatory ignition interlocks for convicted drunk drivers, automated enforcement to speed limits and adherence to traffic lights, banning cell phone use, and, among the others, speed limits adjustment in accordance with roadway design.

Both The USA and EU governments stress the importance of eliminating dangerous speeding behavior.

Technology as part of the solution

The U.S. National Safety Council (NSC) advocates the country-wide establishment of speed limits based on safety and roadway design, aiming to maximize all road users' safety.

Here, at Mireo, using vehicle telematics data, we’ve been tackling road safety successfully for some time now. The onboard telematics devices send data about the vehicles’ whereabouts, speeds, and much more. Consequentially, the telematics data provides authorities with valuable insights into the general public's real-world driving patterns. As a technological enabler, Mireo bypasses the gap between the connected cars’ data and the interested parties desiring to leverage telematics technology as part of road safety.

How can telematics help in better adherence to posted speed limits?

Let's name a few applications with real-world examples:

Speeding hotspots

Proper detection of speeding hotspots helps authorities better place mobile police patrols, mobile and speed cameras and incentivize motorists in a more conscientious driving style through a series of educational and corrective measures. Our Speeding hotspots detection example illustrates speeding hotspots detection using connected cars' data.

Zagreb speeding hotspots detection using connected cars data

Zagreb speeding hotspots detection using connected cars' data

Speed camera placement review

It’s a public secret that motorists speed up just after passing a speed camera, which is precisely the reason why measuring travel speeds is essential in better speed camera placement. Telematics help in better speed camera placement shows how to utilize connected cars' data in reviewing speed camera placement.

Posted speed limits review

On some roads, drivers naturally, of their own accord, respect the speed limits, while on other roads, speeding is more a rule than an exception. An abundance of work was undertaken to address why people speed and disobey posted speed limits. In most places, the root cause of speeding is a fundamental disconnect between design speed and posted speed limits.

As per the U.S. National Transportation Safety Board:

The relationship between speed and crash involvement is complex, and it is affected by factors such as road type, driver age, alcohol impairment, and roadway characteristics like curvature, grade, width, and adjacent land use. In contrast, the relationship between speed and injury severity is consistent and direct.

Based on these guidelines, we advocate reviewing the posted speed limits by cross-correlating the real-world driving speeds on particular road segments with the official crash data. If most motorists drive significantly above the speed limits, and the correlation with traffic accidents doesn't exist, it should be safe to increase speed limits and thus incentivize motorists to drive in a safe-speed range and speed less. And vice versa, communicating the strong correlation of speeding with crash records should incentivize the general public in safer driving.

Scrutinizing the posted speed limits article demonstrates how to, using Mireo SpaceTime Analytics, quickly analyze historical speeding patterns of controversial road segments and determine whether the majority of drivers respect the speed limits or not.

Next steps

If you've found these analyses inspiring and would like to see the similar numerous, on-the-fly calculated road safety analytics running live more than 200.000 vehicles, check out our free SpaceTime online showcase.

SpaceTime Interactive Demo

If you liked this, here’s what to read next: